Wi-Fi access Point placement and the number of APs you use is critical to having a good Wi-Fi experience in your home. Too few APs as well as too many APs can result in less than ideal Wi-Fi. However, many homeowners have no idea how to scientifically determine AP quantity and placement. They just buy one or more APs, throw it in the middle of the house, and hope for the best. Hope is not the right answer when it comes to enterprise grade home Wi-Fi. Let’s throw “hope” out the window and bring in the science!
In this post I’ll cover the following topics:
- What is Predictive RF Planning?
- What’s the best Predictive Wi-Fi Tool?
- Predictive Wi-Fi Planning Requirements
- Homeowner Friendly Predictive Wi-Fi Options
- Who you gunna call? RF Busters!
- Sample Predictive Wi-Fi Model Results
- Manual Site Survey and Validation Methods
- Ruckus One RF Details
- Access Point on a stick (APoS) Survey
- AP Orientation Matters
- AP Transmit Power Considerations
Related Posts
Part 1: Ruckus Unleashed Best Practices Guide
Part 2: Ruckus Unleashed Best Practices Guide
Part 1: Ruckus One Home Wi-Fi Best Practices Guide
Part 2: Ruckus One Home Wi-Fi Best Practices Guide
Enterprise Grade Home Wi-Fi: Ruckus Unleashed vs. Ruckus One
Ruckus Unleashed to Ruckus One Migration Guide
Ruckus One: Provisioning ICX Switches
Unleashing the Power of 6 GHz Wi-Fi: Re-Think Everything
What is Predictive RF Planning?
The best method to determine placement and quantity of Wi-Fi access points is by using predictive Wi-Fi planning, also known as predictive RF (Radio Frequency) design or modeling. It is a process used to predict and design a wireless network. This process uses software to create a virtual model of the intended Wi-Fi environment, such as your house. The software considers various factors including building materials, expected user density, types of devices to be used, and AP model(s) you will be using.
This information is then used to determine the best locations and configurations for access points to optimize WiFi coverage, capacity, and performance. This approach allows network designers to anticipate potential issues and optimize the network setup before any physical installation takes place, saving time, effort, and resources.
Predictive Wi-Fi planning is often used in commercial environments to ensure outstanding coverage and performance across an entire venue. Modeling a hotel, conference center, airport or office building requires sophisticated software and an expert that knows what they are doing.
What's the best Predictive Wi-Fi Tool?
The “Gold standard” of Wi-Fi planning is Ekahau AI Pro. The software alone is over $6,000, not to mention their companion hardware for $5,000 more. However, Ekahau IA Pro is aimed at the professional Wi-Fi installer market and is clearly not meant for homeowners to purchase. Thankfully as a homeowner there are alternative methods to spending $11K on Ekahau IA Pro and taking the needed certification courses. I’ll cover that in a bit.
Predictive Wi-Fi Planning Requirements
In order to accurately model your home, any software needs some basic information about your environment to produce results that you can count on. The most important “input” that the modeling software will need is a highly accurate to-scale floor plan of your house.
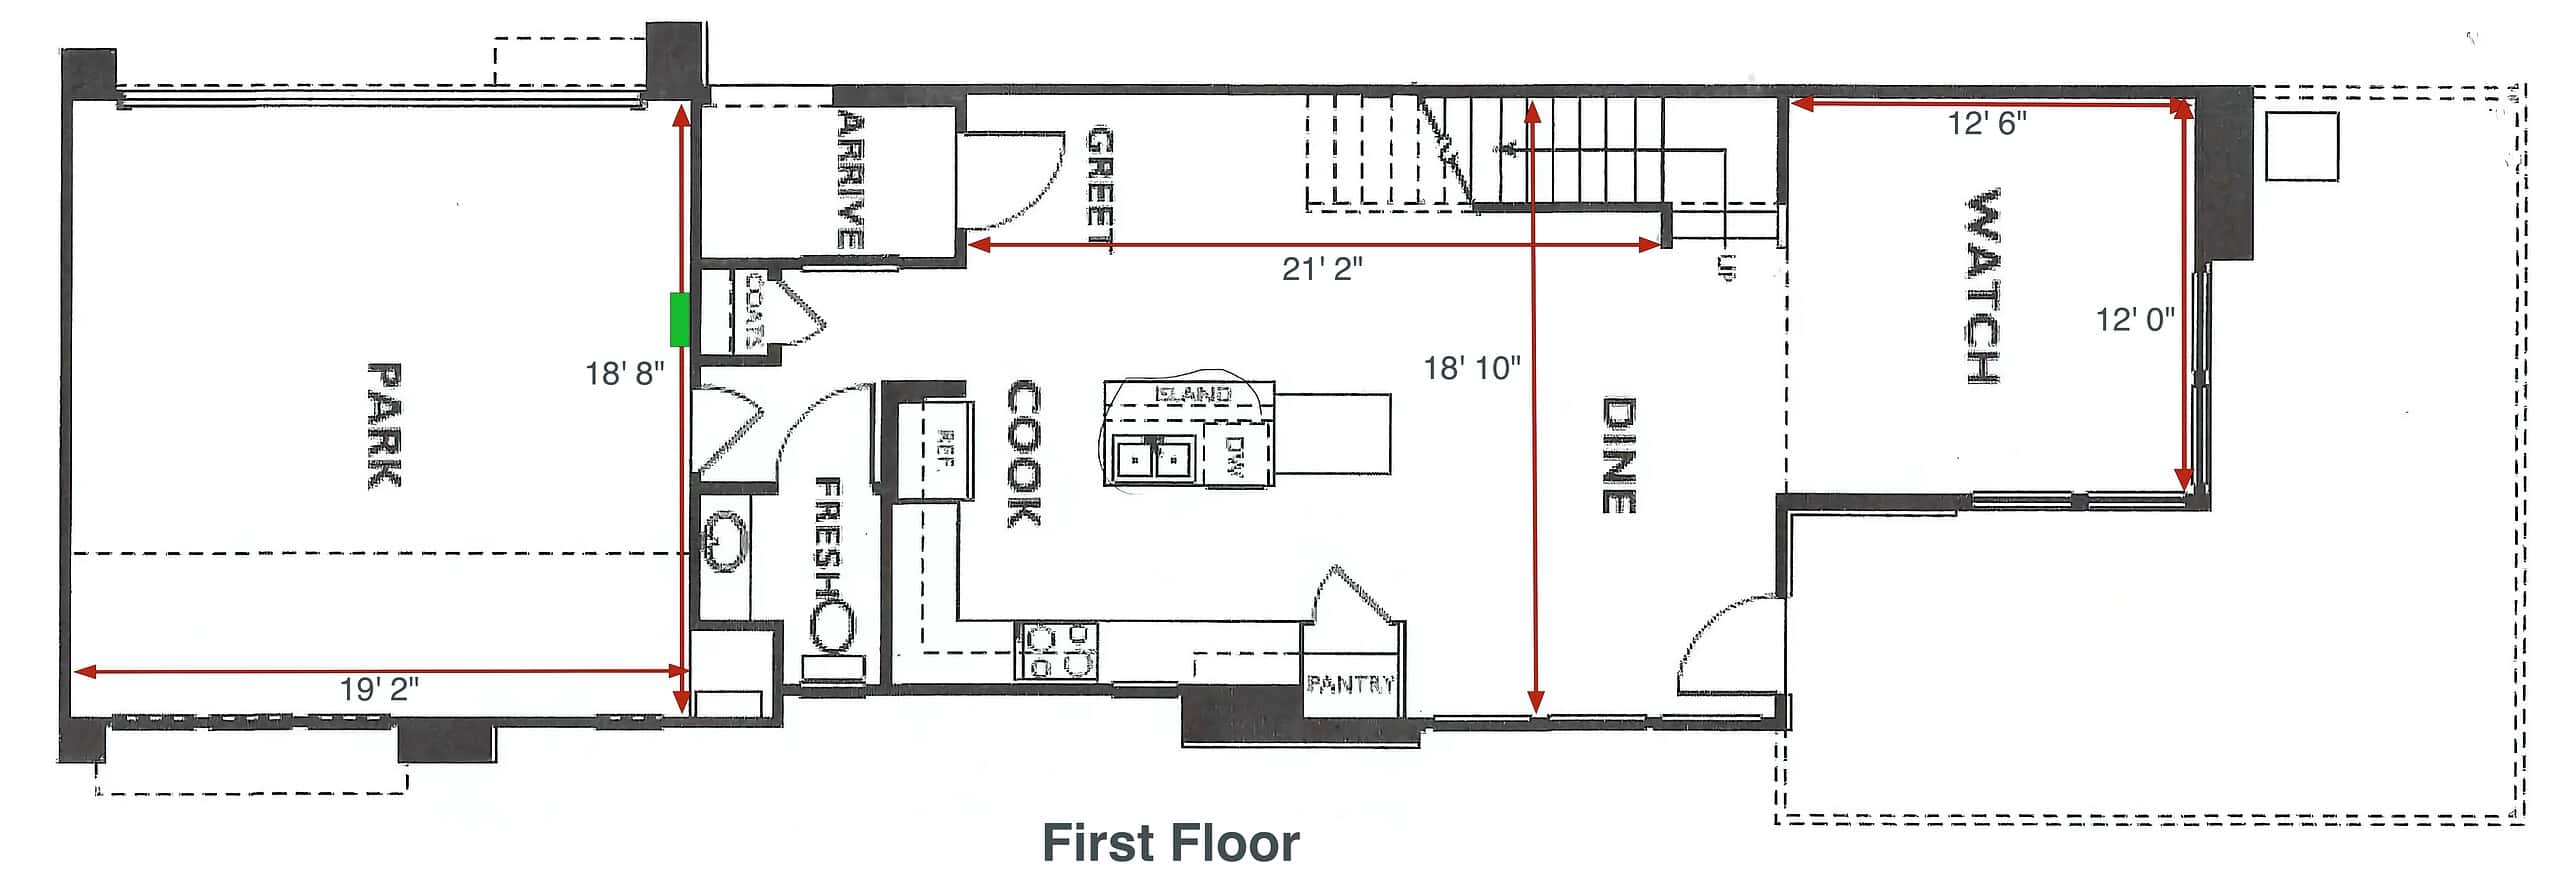
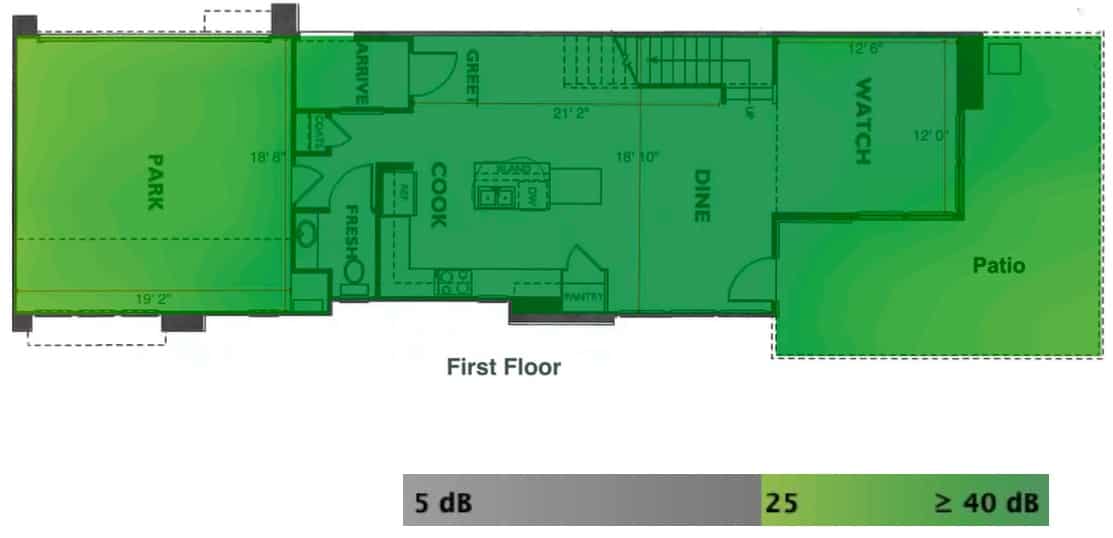
In the sample floor plan below, you can see that was done using a CAD program and has a few of the longer dimensions called out on the diagram. In any of the predictive Wi-Fi modeling tools it has a scaling process where you mark points of the diagram and input the real-world distance. This allows the software to properly scale all of the walls. If your home is multi-story, then you need CAD diagrams for each level.
Tip #1: When submitting your floor plans to for predictive Wi-Fi planning, measure the larger dimensions of areas to provide the software more accurate scaling information. Don’t just measure a door, for example.
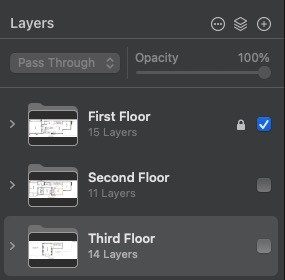
Tip #2: If you have a multi-story home, I took the time to make sure the output JPG images were exactly aligned to each other. This was pretty easy to do in Pixelmator Pro (Mac) using the layers feature.
In addition to providing the planning tool your floor plan, there are a number of other inputs that are needed, such as:
- Interior wall materials (dry wall, concrete, brick, etc.)
- Exterior wall materials (stucco, brick, etc.)
- Ceiling height
- Window types (single/double glazed)
Homeowner Friendly Predictive Wi-Fi Options
If you are on a super strict budget and have a smaller house, then the (limited) FREE version of Hamina might be just want the Wi-Fi doctor ordered. For free it can analyze up to 120 walls and 3 access points. It provides heat map analysis of coverage, data rate, signal-to-noise ratio, and more. However, it will take some learning on your part to properly configure the model. And if your house has more than 120 walls or need more than 3 APs, you are out of luck with the free version.
Arguably the best, but not free, option for predictive home Wi-Fi modeling is to hire a professional. Using a Wi-Fi specialist company can do a full remote predictive model for a few hundred dollars (probably in the $300-$500 range). You will need to supply the highly accurate and to-scale floor plans, as well as answer a number of questions about your environment such as building materials, ceiling height, etc.
Even though a professional predictive Wi-Fi planning report using Ekahau IA Pro can cost you a few hundred dollars, it may well save you money. How? By not over buying APs and also ensure optimal Wi-Fi coverage by specifying exactly where to place your APs. If you are looking at purchasing more than 2 enterprise-grade APs and have a highly accurate to-scale floor plan available, you should strongly consider getting a predictive plan done for your home.
A professional Wi-Fi predictive model for your home, combined with great enterprise-grade APs like those from Ruckus, is the best recipe for enterprise grade Wi-Fi in all areas of your home.
Alternatively, you can use the “AP on a stick” survey method to place your APs in various locations throughout your house and then take Wi-Fi signal strength readings. You can then adjust AP placement as needed to fill in coverage gaps. I’ll go into more details about the manual survey method later in this post.
Who you gunna call? RF Busters!
If you want an accurate predictive Wi-Fi survey done for your house, fully remote, contact InFlux IT consulting. They did my predictive analysis and I was very impressed with the quality of work and PDF reports they provided me. It only took them a few hours after I sent my floor plans over for them to come back with a plethora of heat maps and AP placement recommendations.
Sample Predictive Wi-Fi Model Results
The images below are from a sample Ekahau AI Pro predictive Wi-Fi report. A survey report for a multi-story house can exceed 60 pages, with a plethora of heat maps for all kinds of nerdy stats like signal-to-noise ratio.
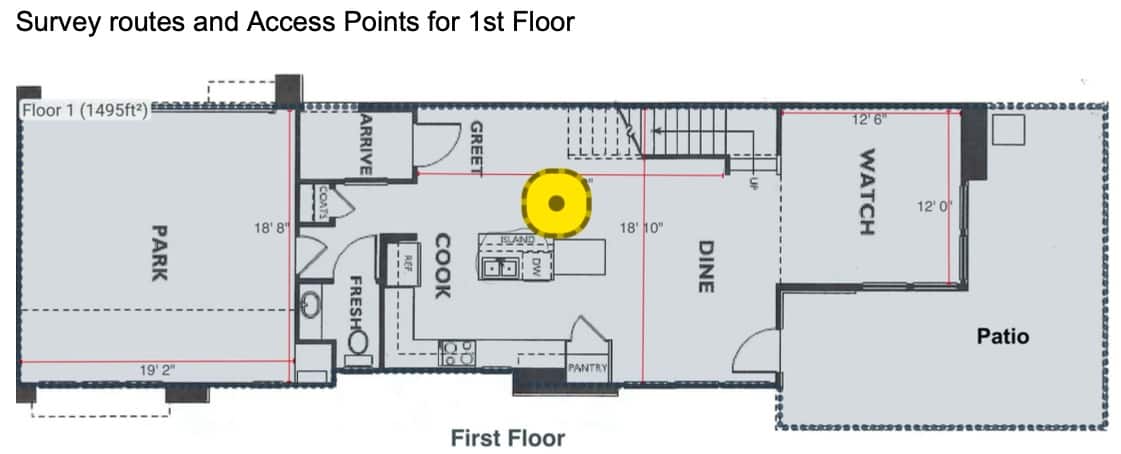
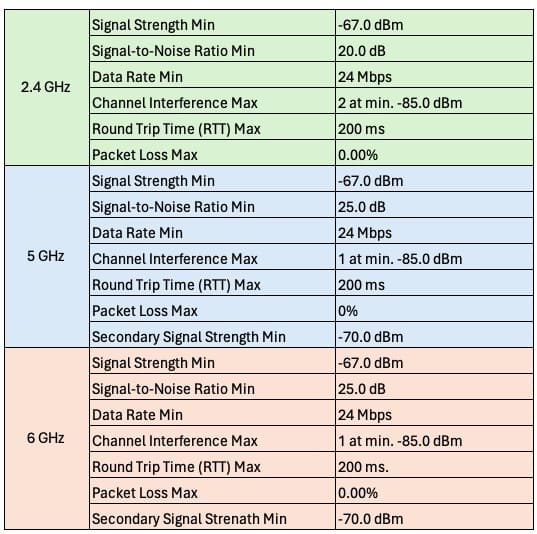
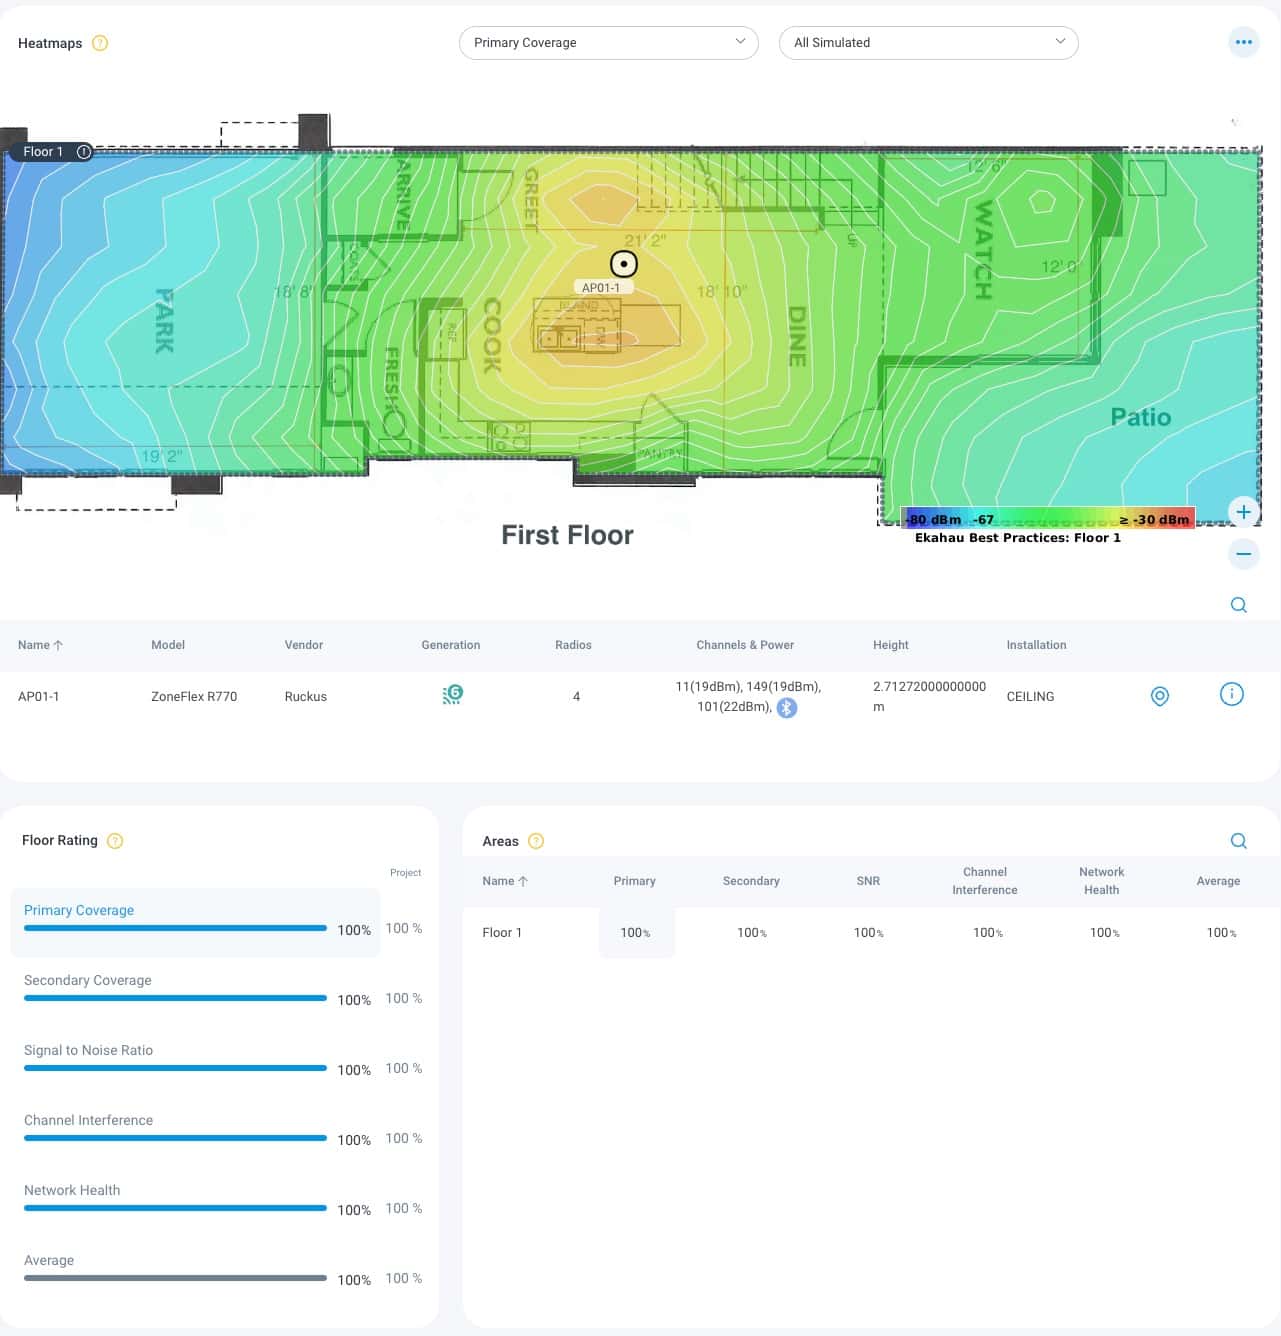
In the sample Ekahau AI Pro diagram below you can see where the software recommends placing the first AP. The second and third floors have AP location placement recommendations (not shown) as well. Ekahau AI Pro recommended 3-4 APs for this particular multi-level floor plan. You can see the Wi-Fi requirements table that Ekahau AI Pro took into consideration when analyzing the house.
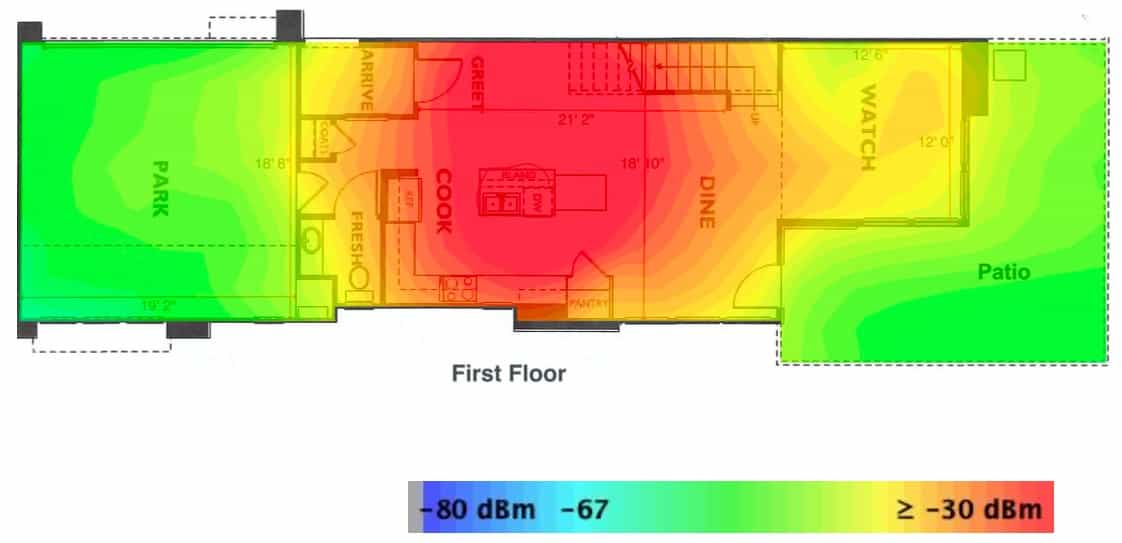
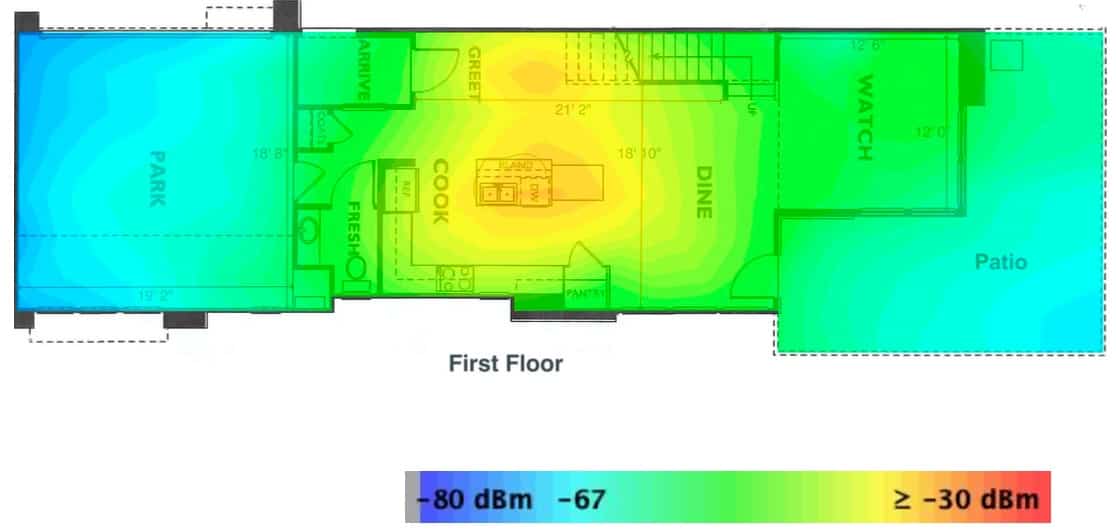
The heat maps below are several out of dozens in the Ekahau AI Pro report. The first series below are for 2.4/5/6 GHz primary coverage on the first floor. As you get further from the AP (over the kitchen island) the signal strength drops into the green and blue shades. But even at the furthest ends of the property there’s an estimated signal strength of -67 dBm, which is fantastic.
In fact, this might be TOO strong and impede client roaming as you move throughout the house. But this is a starting point, and you can always dial down the power post-install to smooth out seamless roaming.
Although not quite as important as primary coverage, Ekahau AI Pro will also show you secondary coverage. What is secondary coverage? This is coverage of an area by APs other than the primary AP. Secondary coverage is important for redundancy and ensuring smooth roaming. Secondary coverage is critical in a business environment, but still should be considered in a residential setting.
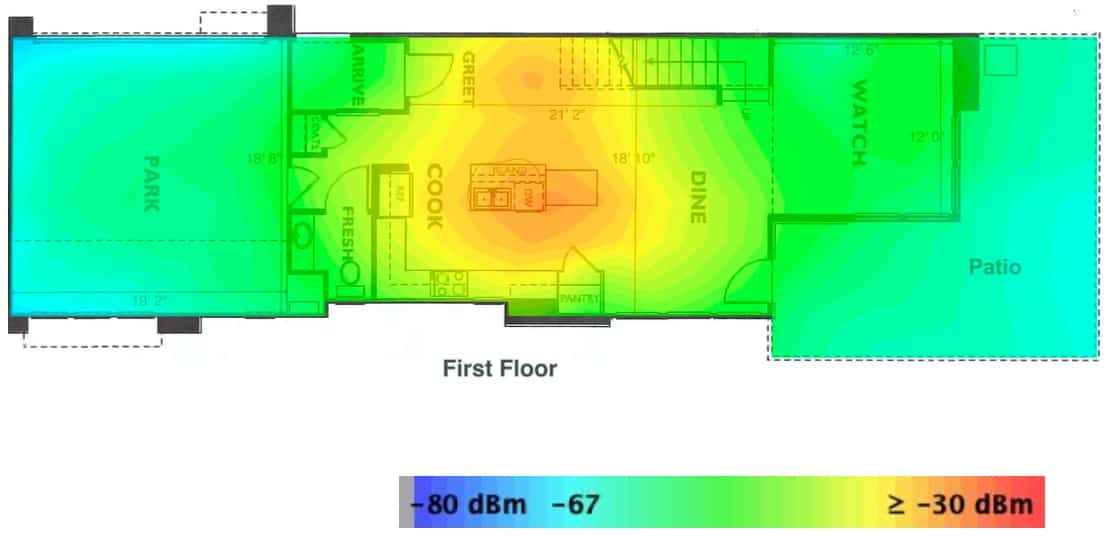
In the heat map below you can see the projected first floor SNR (Signal-to-noise ratio) throughout the property. A high SNR means a better signal, and probably better throughput. A SNR of 25 or more is very good, and in the Ruckus One dashboard this will show as green client health. This heat map is for the 6 GHz spectrum, which as you will recall has the highest attenuation and thus shortest range. But we are still covered throughout the whole property.
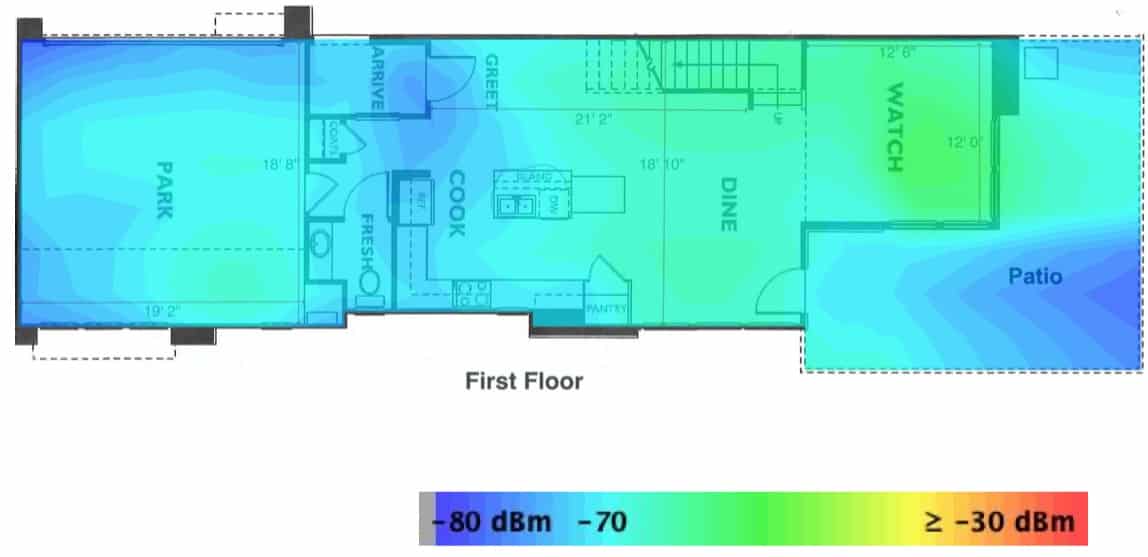
Finally, in the first floor overview you can see the ratings for primary coverage, secondary coverage, channel interference, network health, and more for the 5 GHz band. Again, the images above are just samples from a full report. There are additional heat maps which I didn’t show here.
Manual Site Survey and Validation Methods
Even if you have a professional predictive Wi-Fi plan done for your home, I would suggest doing a post-install manual survey to validate the coverage. Why? Models aren’t perfect, and spending a bit of time to validate your Wi-Fi coverage is well worth it. This is really important for seamless client roaming. For the best roaming experience you may need to adjust the transmit power levels of your APs. Doing a manual site survey can help you understand how to adjust transmit power levels for optimal roaming.
Here’s how you can perform a manual survey:
1. Sketch a Floor Plan: Start by creating a detailed blueprint of the area where the Wi-Fi coverage is needed. Include all the structural features like walls and rooms. This will act as a reference for your readings. The best source is a to-scale 2D CAD floor plan diagram from your home’s builder. If you don’t have such a diagram, you can make one yourself. Although I haven’t tried it myself, the free Sweet Home 3D program might do the trick. I’ve read it has a moderate learning curve.
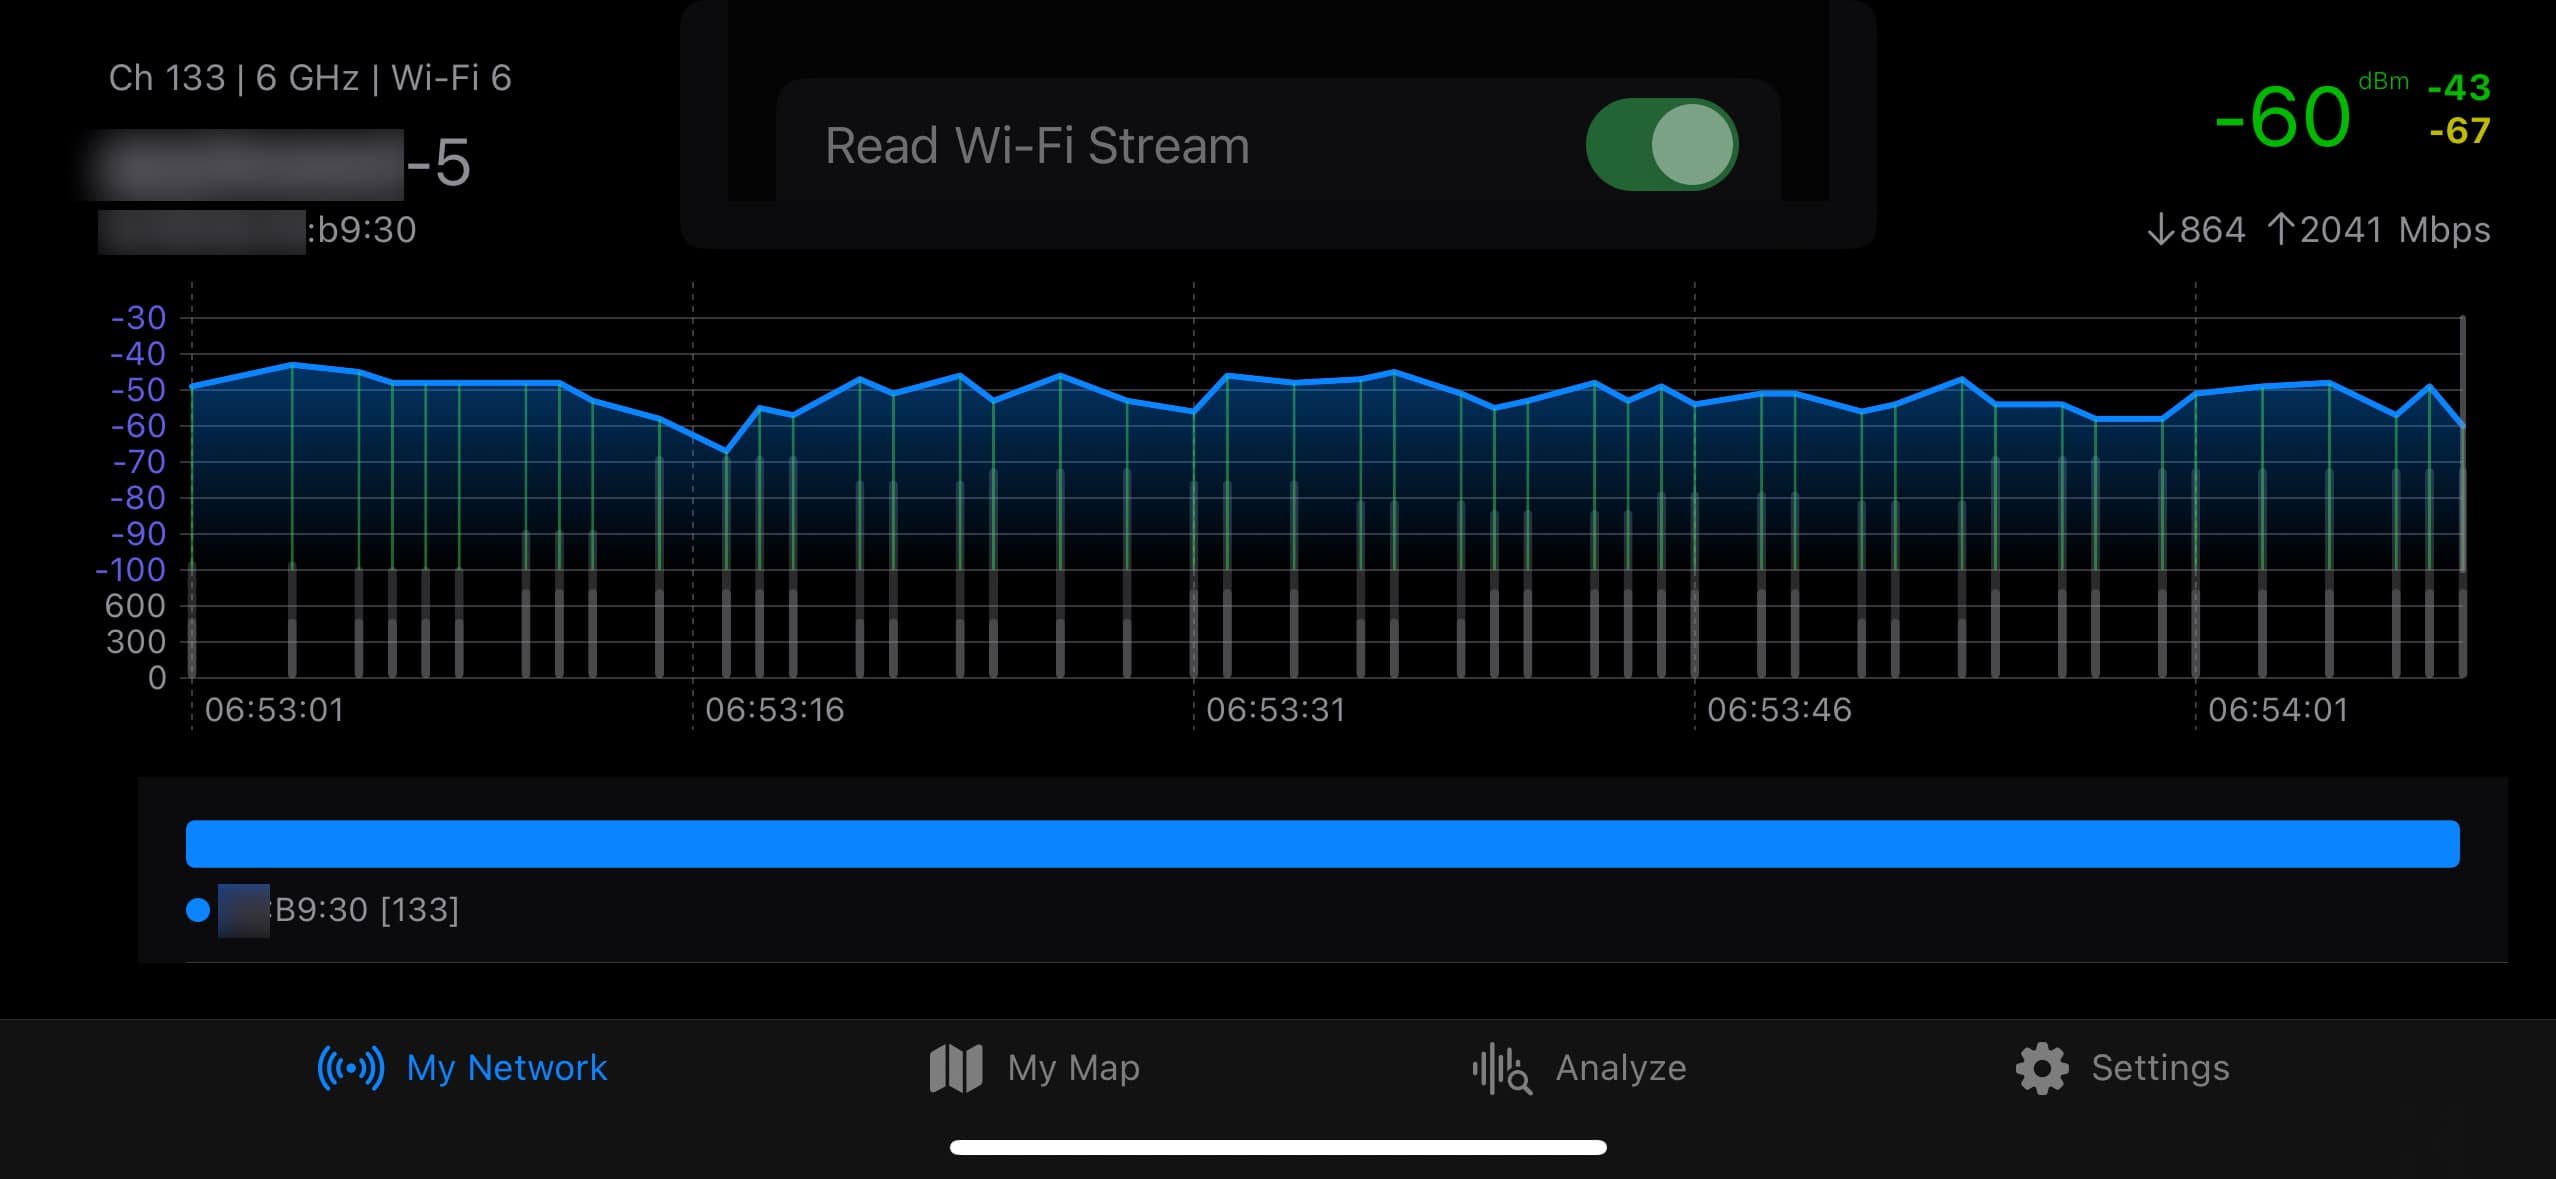
2. Choose a WiFi Analysis Tool: Download and install a WiFi analysis app on your mobile device or laptop. Some popular options include Wi-Fi Analyzer for Android and nOversight WiFi Analyzer (screenshot below) for iOS. Netspot for Mac and Windows is also a great option if you want to use a laptop. Netspot will let you import floor plans and produce your own Wi-Fi heat maps.
3. Take Readings: Use the app and walk slowly around your home, marking down the signal strength at various points on your floor plan. It’s important to note down the signal strength in dB, the more negative the number (e.g. -80 is weaker than -67), the weaker the signal. If you have SSIDs for different bands (e.g. 2.4 GHz and 5 GHz), record values for all bands.
4. Identify Dead Zones: Dead zones are areas where your WiFi signal is weak or nonexistent. These will appear as areas with high negative dB readings on your blueprint. Values weaker than -77 dB may present issues.
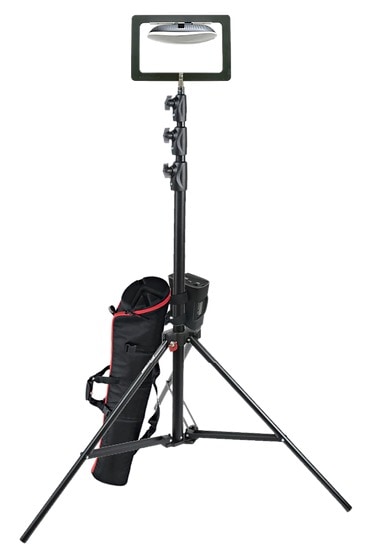
5. Test Different Configurations: Place your access point at different spots and repeat the survey. Make sure to test multiple scenarios and at different heights. A great solution for temp Wi-Fi AP placement is to use the “AP on a stick” method, using the WiFiStand.
6. Analyze and Optimize: Use the data you’ve collected to identify where you need to add extra access points, where to reposition existing ones to optimize your Wi-Fi coverage.
Remember, this process may need to be repeated several times until you find the arrangement that gives you the most reliable and robust coverage. The goal is to minimize the dead zones and provide strong and consistent Wi-Fi coverage throughout your house.
Ruckus One RF Details
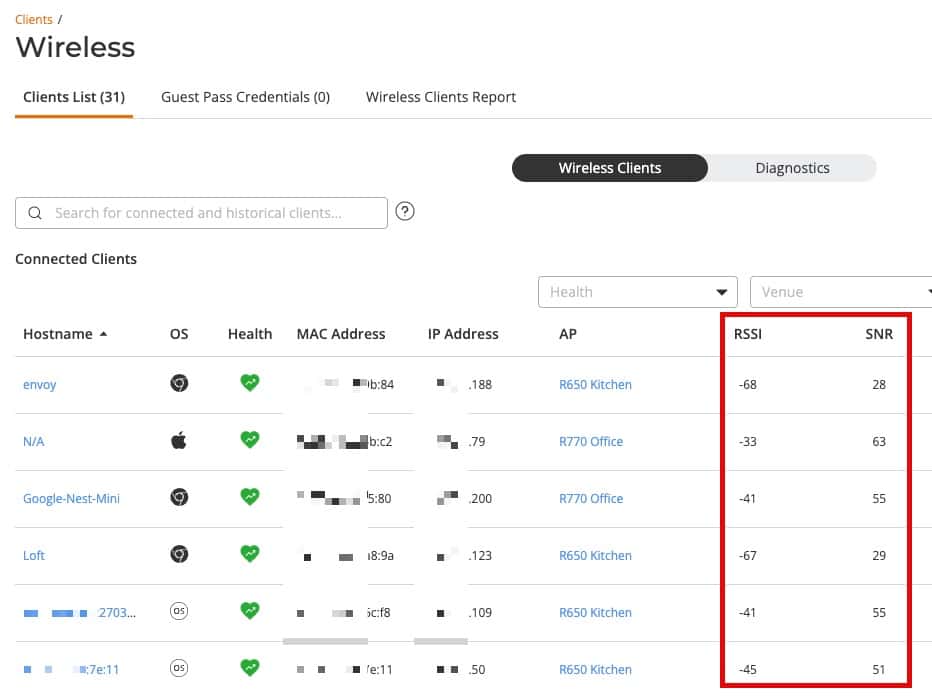
One nice feature in Ruckus One is the displaying, in list format, of all the RSSI and SNR values for connected clients. This is very helpful for IoT devices sprinkled around your home. You can ensure that all of your devices have a strong signal and hopefully follow the signal levels on your predictive model. Plus you can see which AP the device is connecting to, furthering your knowledge of how your Wi-Fi is performing.
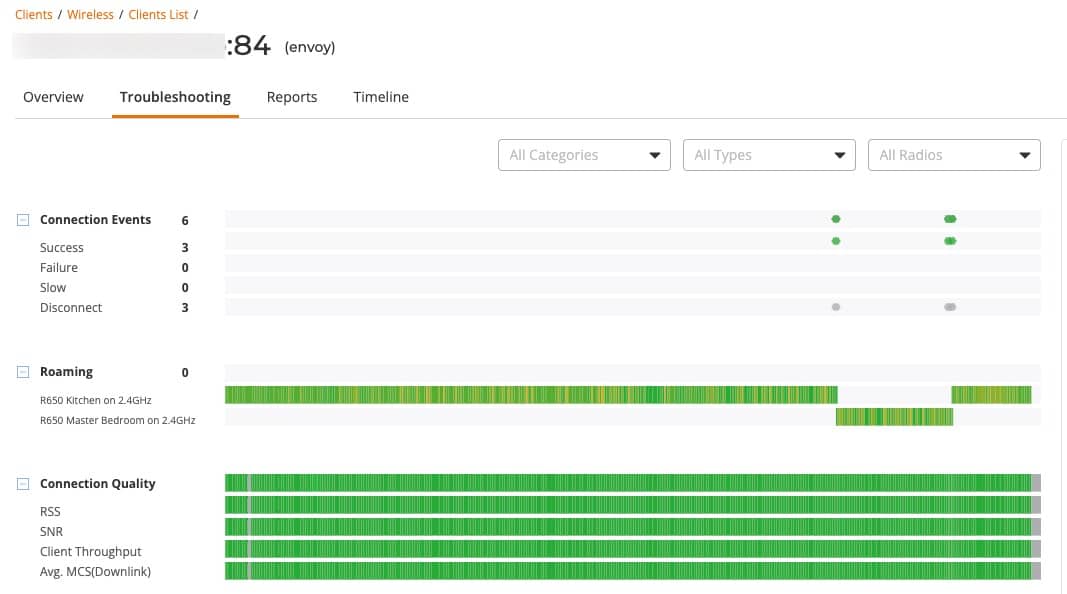
Also in Ruckus One is a per-client troubleshooting page that tracks, long term, a lot of connection details. This can be helpful to monitor if you adjust AP placement or transmit power over time.
Access Point on a Stick (APoS) Survey
The AP-on-a-Stick (APoS) survey is a method used to collect necessary data for planning and creating a Wi-Fi network before permanently mounting your APs. It involves a physical survey using temporary setups of Access Points (APs) at different locations throughout the site. You can use the APoS method to validate your predictive Wi-Fi plan (before permanently mounting your APs), and ensure that real-world coverage matched that of the model.
To accurately simulate the position of your APs you will need some way to temporarily mount the APs. Typically ceiling placement for APs is the best, but you don’t want to be drilling random holes around your house just to do AP placement tests. I would suggest buying a Wi-Fi stand which is designed for the APoS method. The kit consists of a tripod stand and an AP bracket. You can get a basic kit for $128 USD.
The survey methodology is similar to the manual site survey as described above. But I do have a few additional tips:
- You may want to create multiple temp “survey” SSIDs, one for each band, if your production SSIDs span two or more bands (e.g. survey-2.4, survey-5, survey-6).
- Note the BSSID’s of your APs so you know which AP you are connected to.
- Plan on at least 1 hour per AP.
AP Orientation Matters
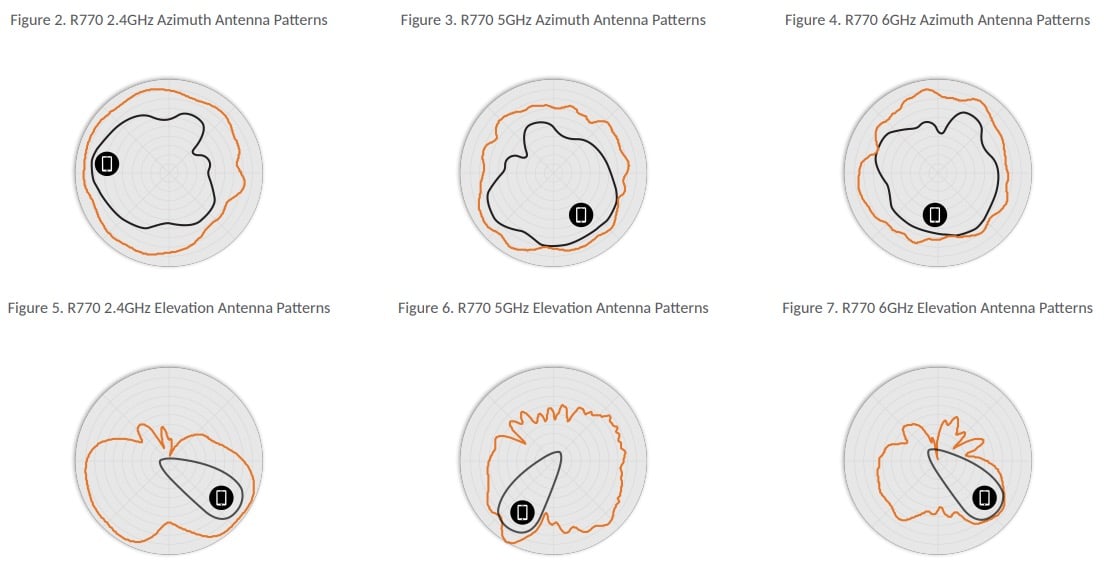
Although a detailed discussion is out of scope for this post, you do need to be at least casually aware of the antenna patterns for your selected AP. This is particullarly important when you are manually placing APs and not using a predictive model using a program like Ekahau AI Pro. For a short Ruckus video on how to read their antenna patterns (found on their data sheets), check out the Youtube video below. Without watching the short 3 minute YouTube video the antenna patterns below won’t make any sense to you.
In short, orientation of the AP matters and the signal pattern can vary wildly between models and bands. An AP placement pattern for multiple R650s may not be at all optimal for multiple R770s, for example. Or if you have Eero APs now and want to replace them with Ruckus APs, the optimal locations will probably be different from what you have currently deployed.
AP Transmit Power Considerations
Depending on the number of APs you are deploying to your home, you will likely need to adjust the transmit power. Why? Blasting your home at full power on all bands with multiple APs will probably lead to non-optimal client roaming. Client roaming decisions are made by the client, although the APs can help provide ‘hints’ that a client should select another AP.
One of these ‘hints’ is adjusting the transmit power. If your home has a single AP, then you should probably leave all bands at full power, to avoid dead zones. However, if you are deploying two or more APs, lowering the transmit power can actually be a good thing.
On the 2.4 GHz band in particular, which has the longest range, lowering the AP transmit power is likely a very good idea. How much? Either rely on your predictive Wi-Fi survey, or do your own real-world survey to measure actual signal strength throughout your house. IoT devices don’t typically roam, so roaming tuning on 2.4 GHz might not be as important as 5/6 GHz. For example, in my home I have all 2.4 GHz radios set to -7 dBm power.
Since the 5 GHz and 6 GHz bands have higher attenuation due to physics, reducing power is a bit more tricky. Plus, you want a stronger 5 GHz signal than 2.4 GHz for optimal client performance. Trial and error is the game here, without using software like Ekahau AI Pro to dial in the transmit levels. I’ve found that even with a predictive model, that client roaming can be tricky. Some clients might be “sticky” and thus require manual AP transmit power adjustments to fine-tune roaming.
Summary
For enterprise grade Wi-Fi in your home, some planning and work is needed. The number of APs, their placement, along with transmit power are all key areas you need to thoroughly investigate. Thankfully there are companies which can do a Wi-Fi predictive survey to answer all of these questions. They will use enterprise grade (e.g. super expensive) modeling software like Ekahau AI Pro to thorough evaluate your floor plan. You can probably get a comprehensive Wi-Fi predictive survey for $500 or less.
If budget doesn’t allow for a paid survey, there are free tools and other methods available to help optimize your environment. In addition, there are other factors you need to consider such as AP orientation, AP radio patterns, and AP transmit power. When all of these factors are taking into consideration for a Wi-Fi design, you are setting yourself up for enterprise grade Wi-Fi in your own home. But some work is needed! You just don’t throw a couple APs in random locations and hope for the best.