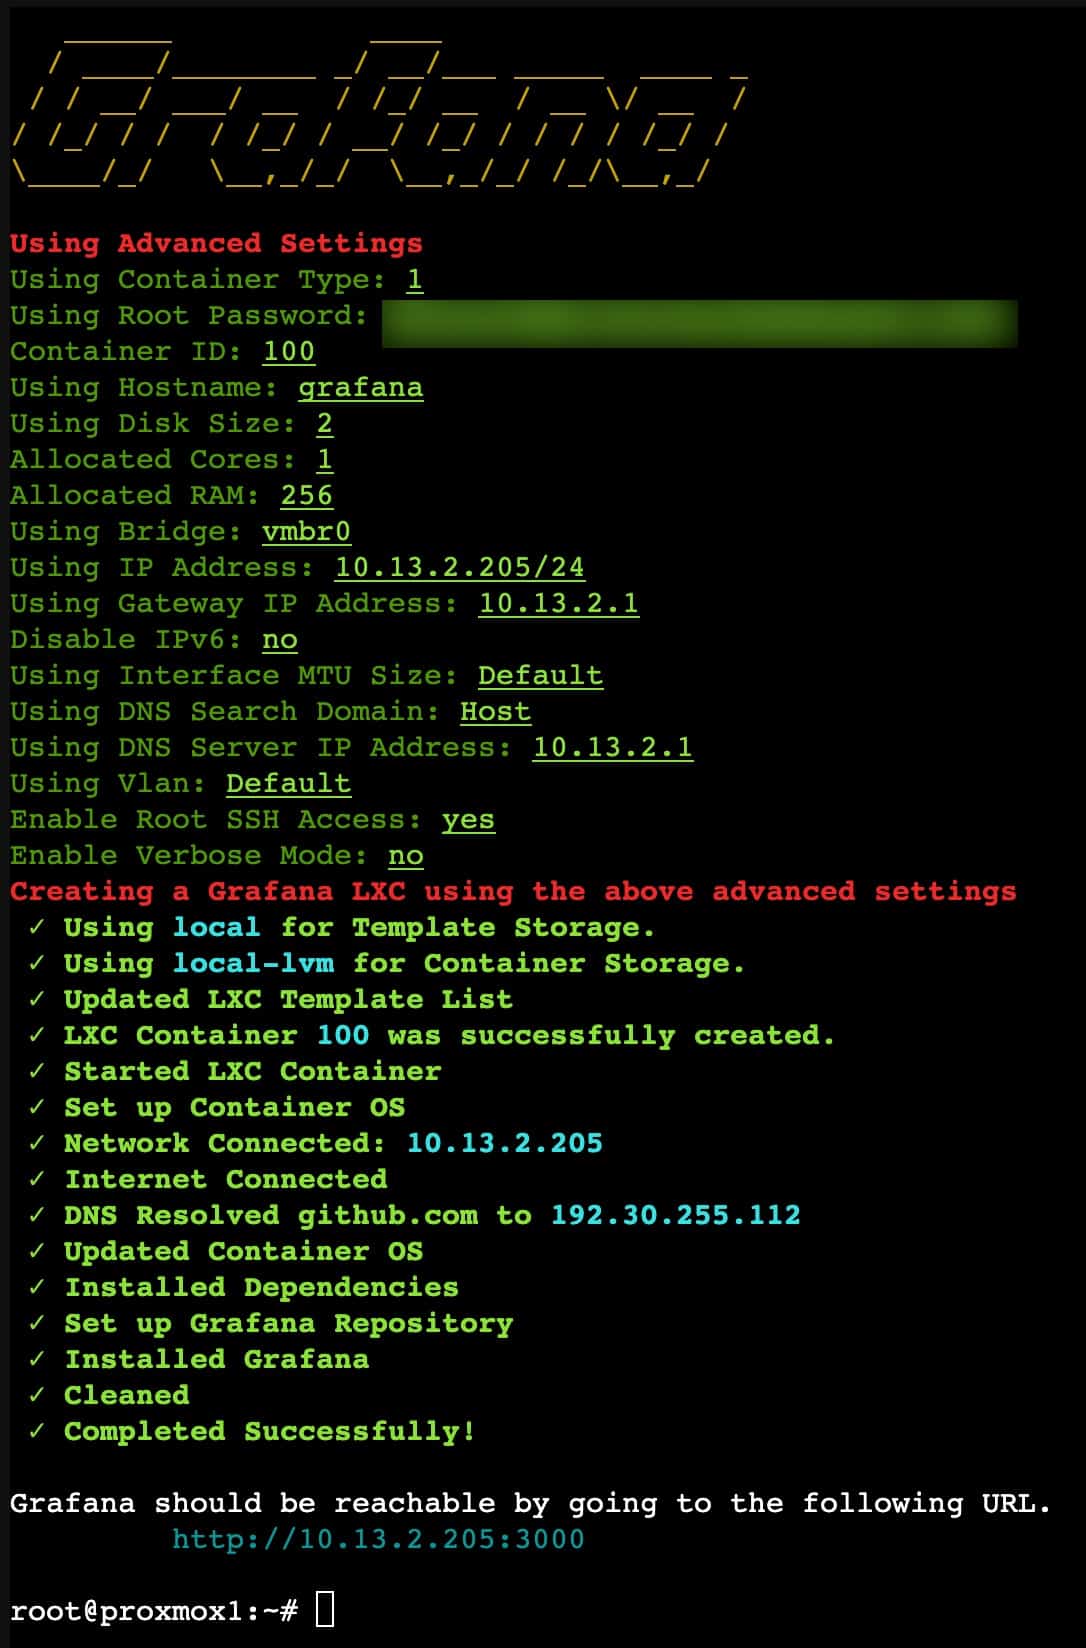
5. Leave Container Type Unprivileged.
6. Enter a complex password.
7. Accept the container ID.
8. Set the Hostname.
9. Leave the Disk Size.
10. Leave the Core Count.
11. Reduce RAM to 256MB.
12. Leave the Bridge.
13. Optionally set a static IP (e.g. 192.168.10.45/24).
14. Set a Gateway IP.
15. Don’t disable IPv6 (unless you need to).
16. Leave MTU Size.
17. Set DNS Search Domain (if needed).
18. Set a DNS server IP.
19. Leave the MAC address blank.
20. Leave the VLAN.
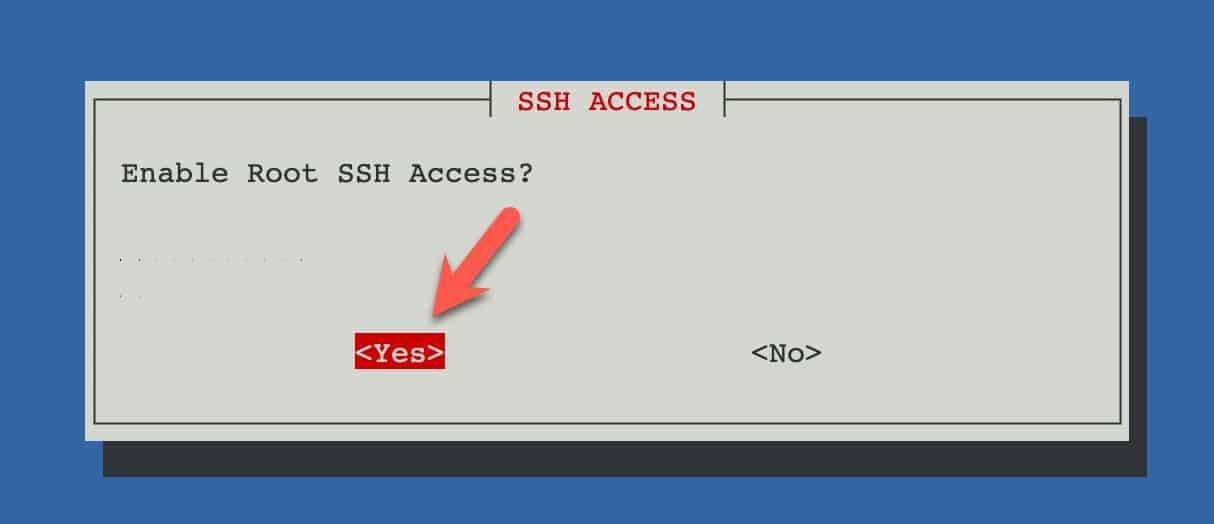
21. Enable Root SSH access.


Hi,
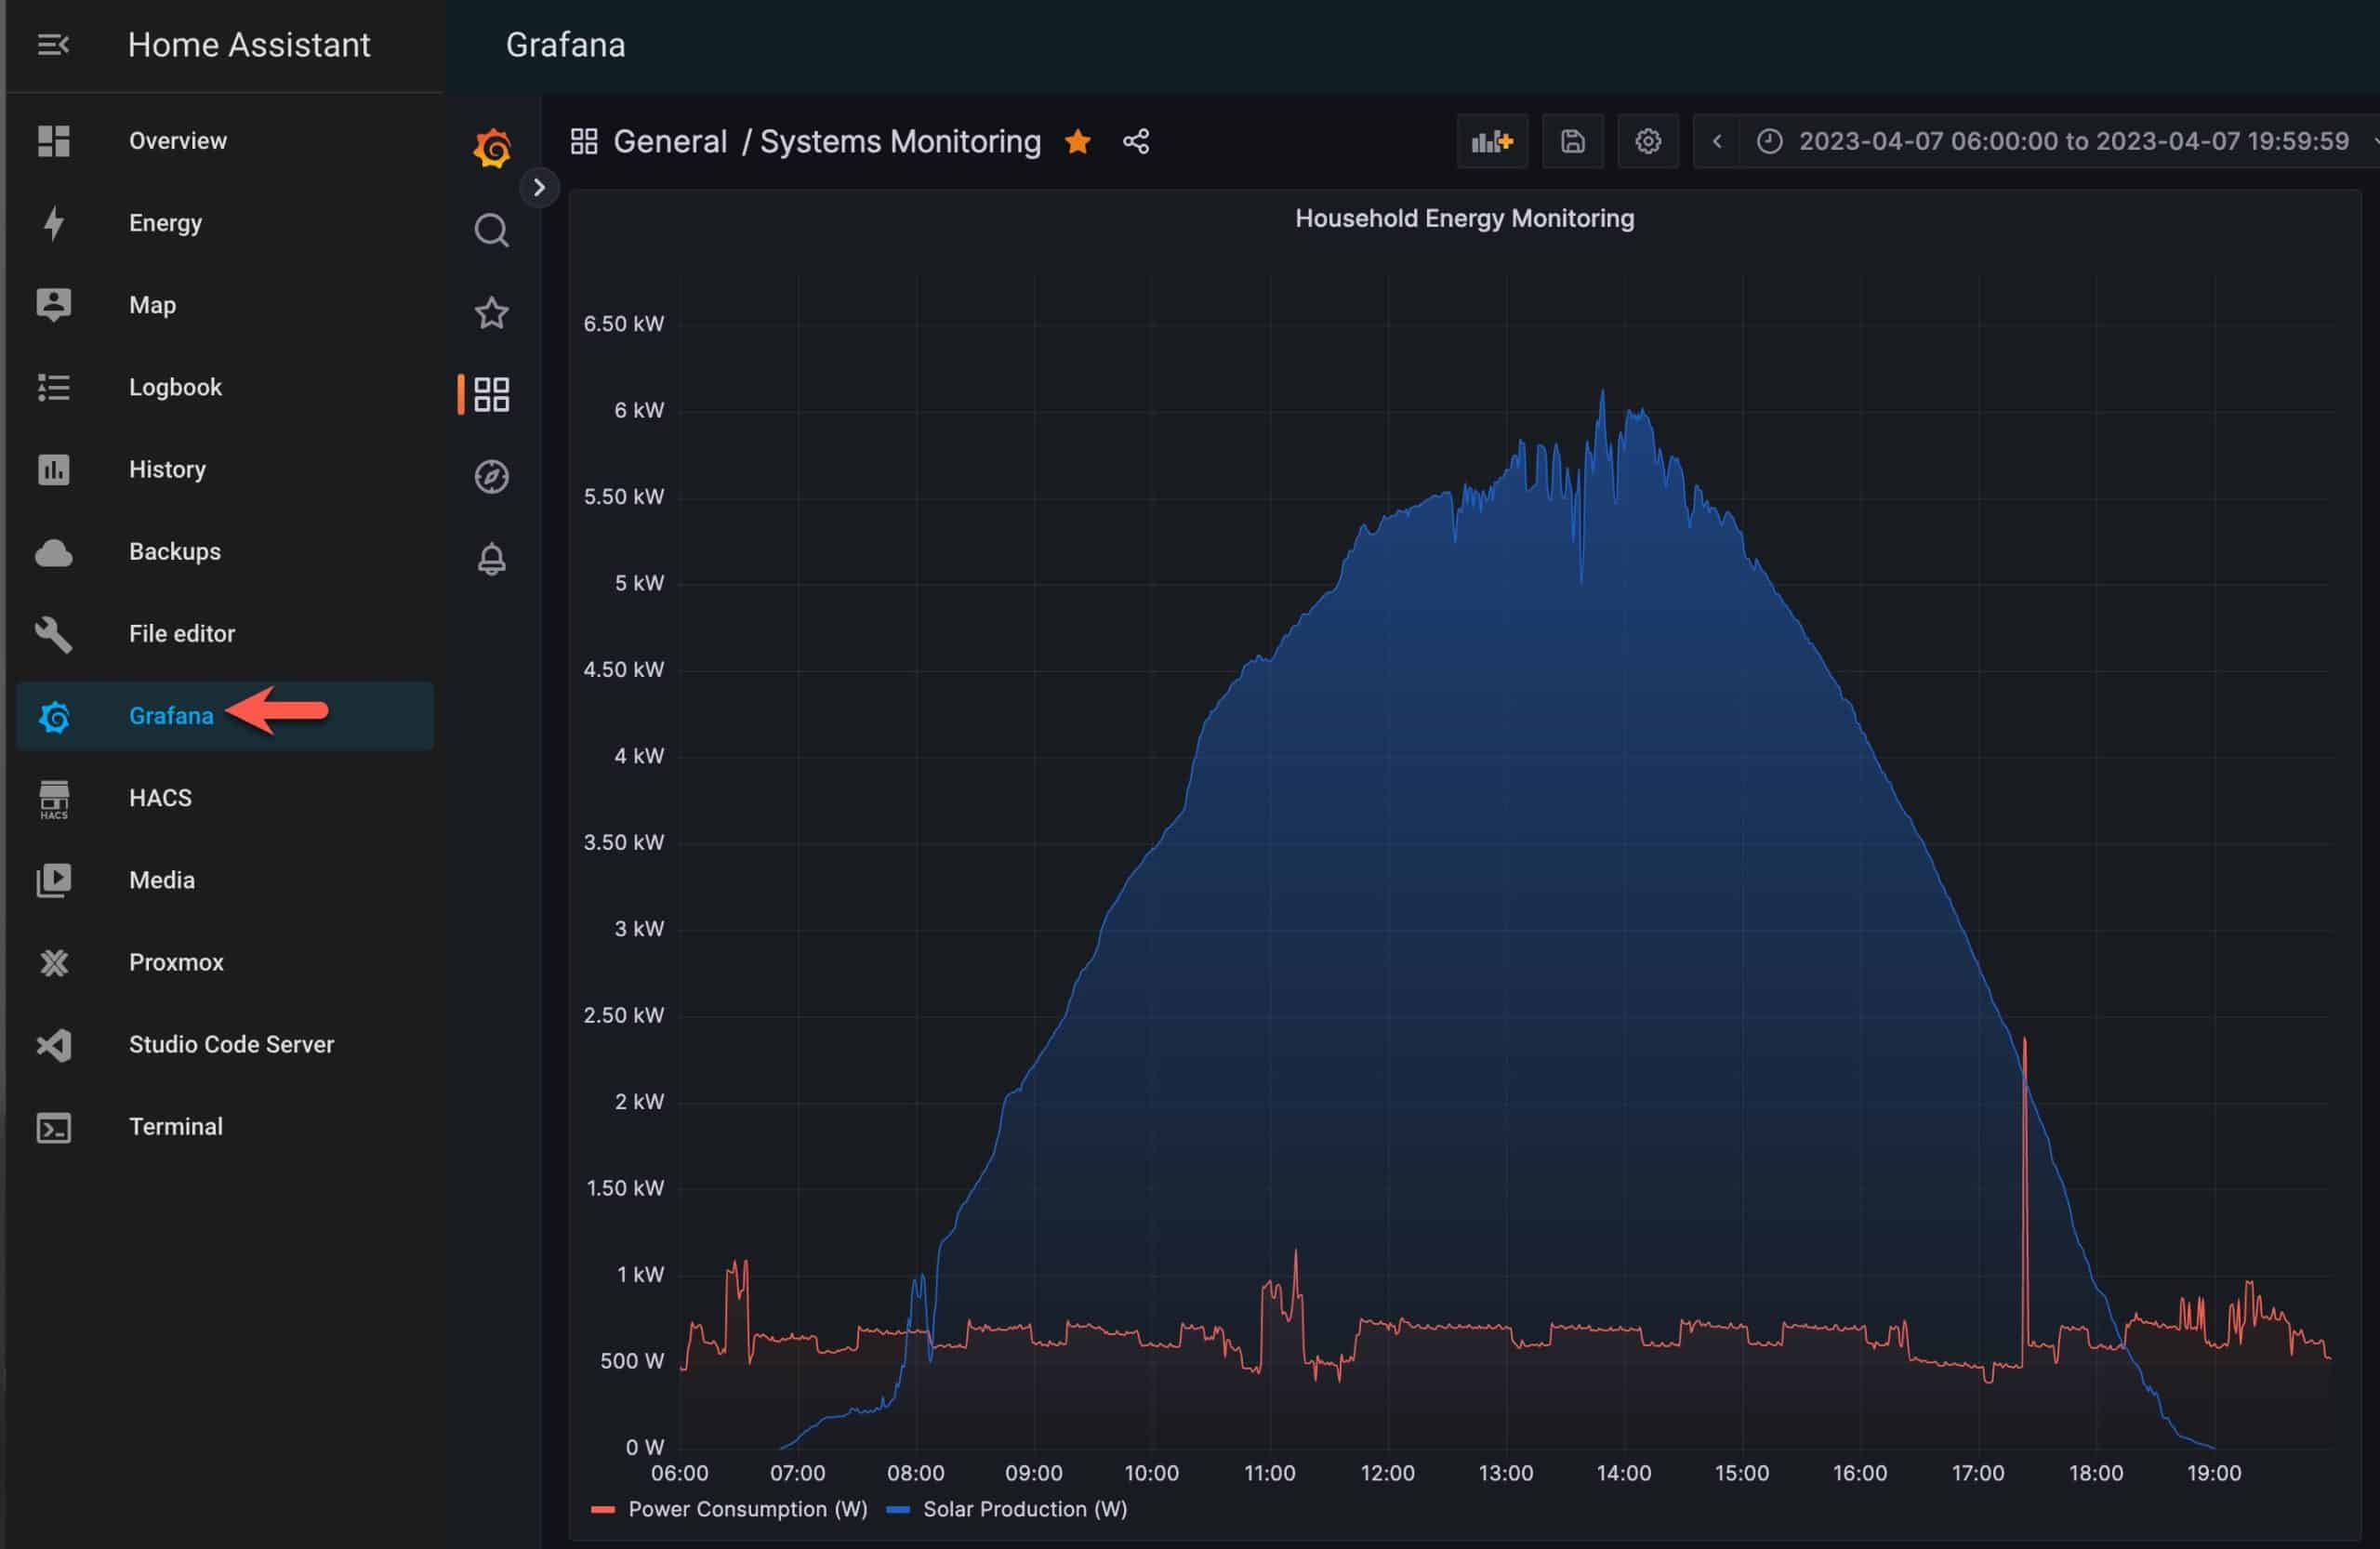
I’m having some difficulties adding an Grafana iframe to HA. Does this config work with Cloudflare tunnels? I have a tunnel configured to https://grafana.mydomain.com that is working but if I use that URL on panel_iframe I get an error “grafana.mydomain.com refused to connect”.
What am I missing?
Been following some of your guides and they are amazing, thanks for your work!
— edit
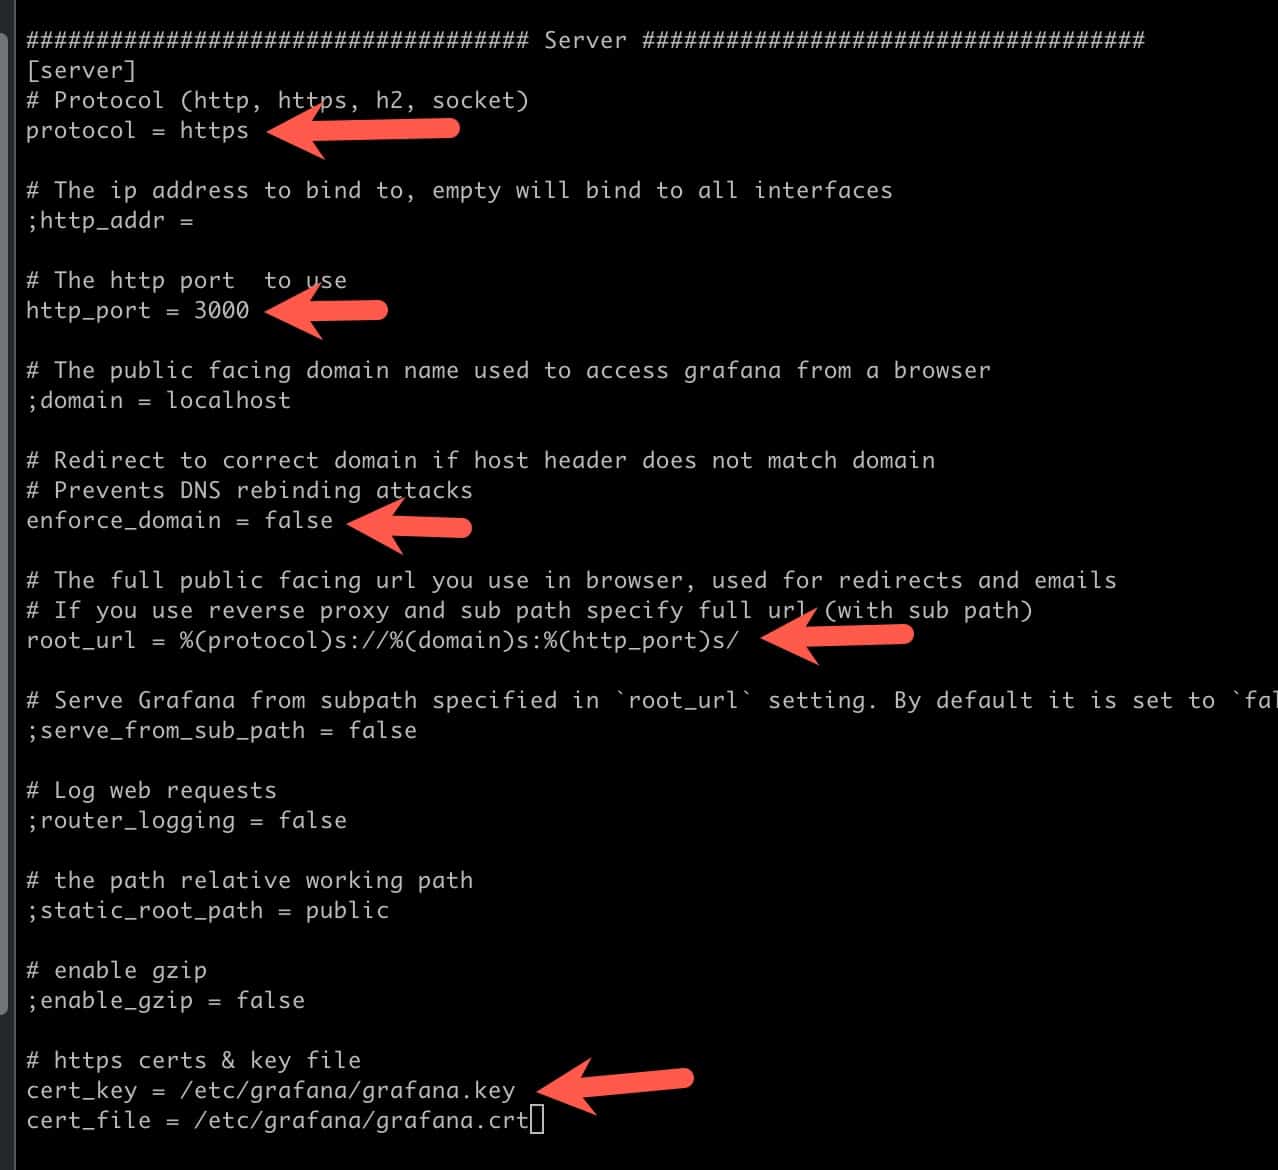
It’s working now, didn’t noticed the semi-colons on the grafana.ini file 🙂
I have been following your guide/instruction and they have been great. I installed it and it was working, Now I tried created SSL, all steps were successful, however I am unable to access grafana via new grafana.mydomainxy.com:3000 or even via direct IP address.
Amy thought, I have double checked all stuff, though I reach out before I reinstall it.
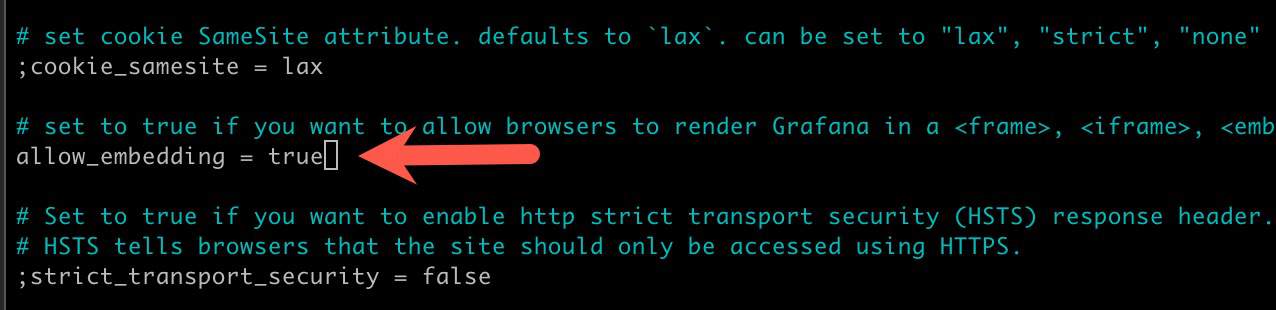
Had problems with iframe.
Solution:
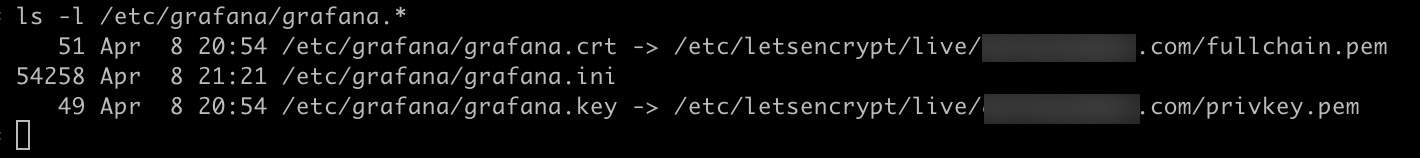
in grafana.ini