If you are running Home Assistant OS (HAOS) as a VM on Promox, you may want to display the hardware sensor data (CPU load, CPU temp, disk utilization, etc.) of your Promox host inside Home Assistant. To do this we will install the Glances server on the Proxmox host, then use the Home Assistant integration to pull in that data so we can view it.
If you install the Glances add-on inside the HAOS VM, it won’t have access to the physical hardware sensors. So that’s why we are installing Glances on the Promox server itself and just use the Glances Integration to pull in the data.
There are two Proxmox add-ons for Home Assistant. This is complimentary to the Glances Integration. The Proxmox integrations don’t display all the CPU temperature sensors and a number of other sensors, but it does show VMs, LXC containers, etc. I suggest using the HACS Proxmox integration, as unlike the official Proxmox integration, it will allow you to control various aspects of the Proxmox host such as restarting VM, rebooting, etc.
You can check out the lm-sensor documentation for additional details on sensors that might not be enabled by default on your server. Glances leverages this package for sensor reporting.
Update February 9, 2026: I’ve updated the instructions to work on a broader range of Proxmox versions, including 8.x and 9.x. The new approach is safer and uses and isolated python environment.
Update December 2, 2023: Thanks to reader feedback I added a step to load the drivetemp kernel module so Glances can report SATA drive temperature. I also added a link to the lm-sensor package (above) for more sensor information.
Update November 25, 2023: Thanks to reader feedback I modified the procedure to force Glances authentication when browsing to port 61208. I also added a credential reset section at the end.
Update June 23, 2023: Proxmox VE 8.0 is based on Debian bookworm, which initially causes a python compatibility issue with Glances. However, thanks to tteck, he provided a solution which I’ve incorporated into this guide. If you upgrade to Proxmox VE 8.0, and had Glances working on a prior version you will need to re-install. After I re-installed, the Home Assistant Glances add-on was immediately able to resume communications to Glances and the stats were restored.
Glances Installation
1. In the Proxmox web UI click on your physical server in the left pane, then click on Shell in the middle pane.
apt-get install pipx
The commands below performs the Glances installation:
					pipx install 'glances[all]'
ln -s /root/.local/bin/glances /usr/local/bin/glances
2. Wait a minute or two for everything to install. Then start Glances with the following command:
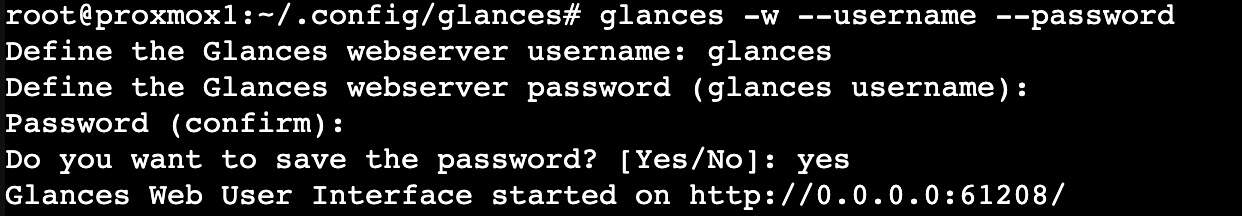
glances -w --username --password
3. Enter a username and password for the Glances service. Answer Yes to save the password. Press CTRL-C to stop the Glances service. Write down this password as Glances saves it in config file. Note: I suggest using the username ‘glances’ as this is used in step #6. Or change it in both places.
4. In order to monitor the drive temp of SATA drives, we need to load the drivetemp kernel module at boot.
					echo "drivetemp" >> /etc/modules
modprobe drivetemp
5. Run the following command:
nano /etc/systemd/system/glances.service
6. Copy and paste the following text into nano. If you configured a username other than glances, modify line 6 as needed.
					[Unit]
Description=Glances
After=network.target

[Service]
ExecStart=/usr/local/bin/glances -w -u glances
Restart=on-abort
RemainAfterExit=yes

[Install]
WantedBy=multi-user.target
7. Press CTRL-X to exit and Y to save. Run the following command to make a symlink.
systemctl enable glances.service
8. Now we can start the service:
systemctl start glances.service
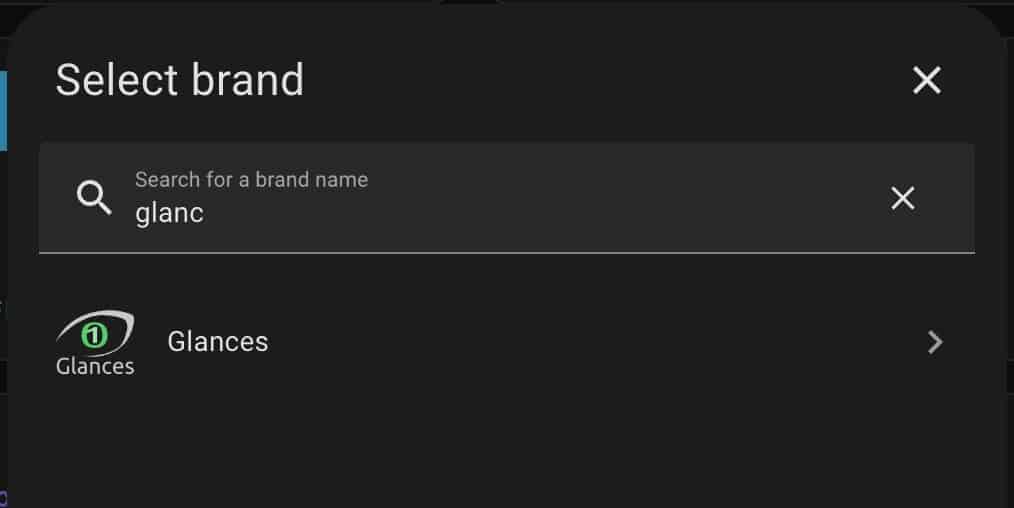
9. Go to Home Assistant Settings -> Devices & Services and click on Add Integration. Search for Glances.
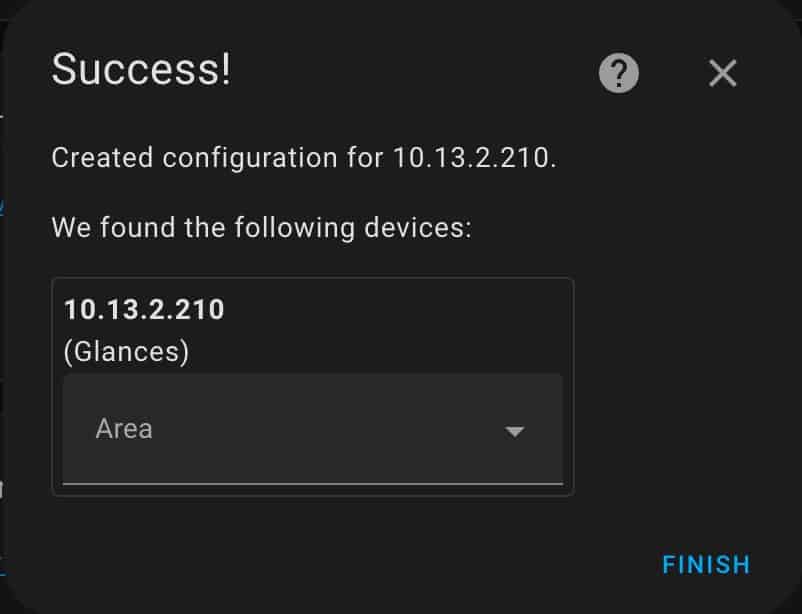
10. On the configuration screen enter the IP address of your Promox server, and the username/password that you configured earlier. Leave the rest of the settings at the default values. Click Submit. If all goes well you will get a prompt for selecting the area.
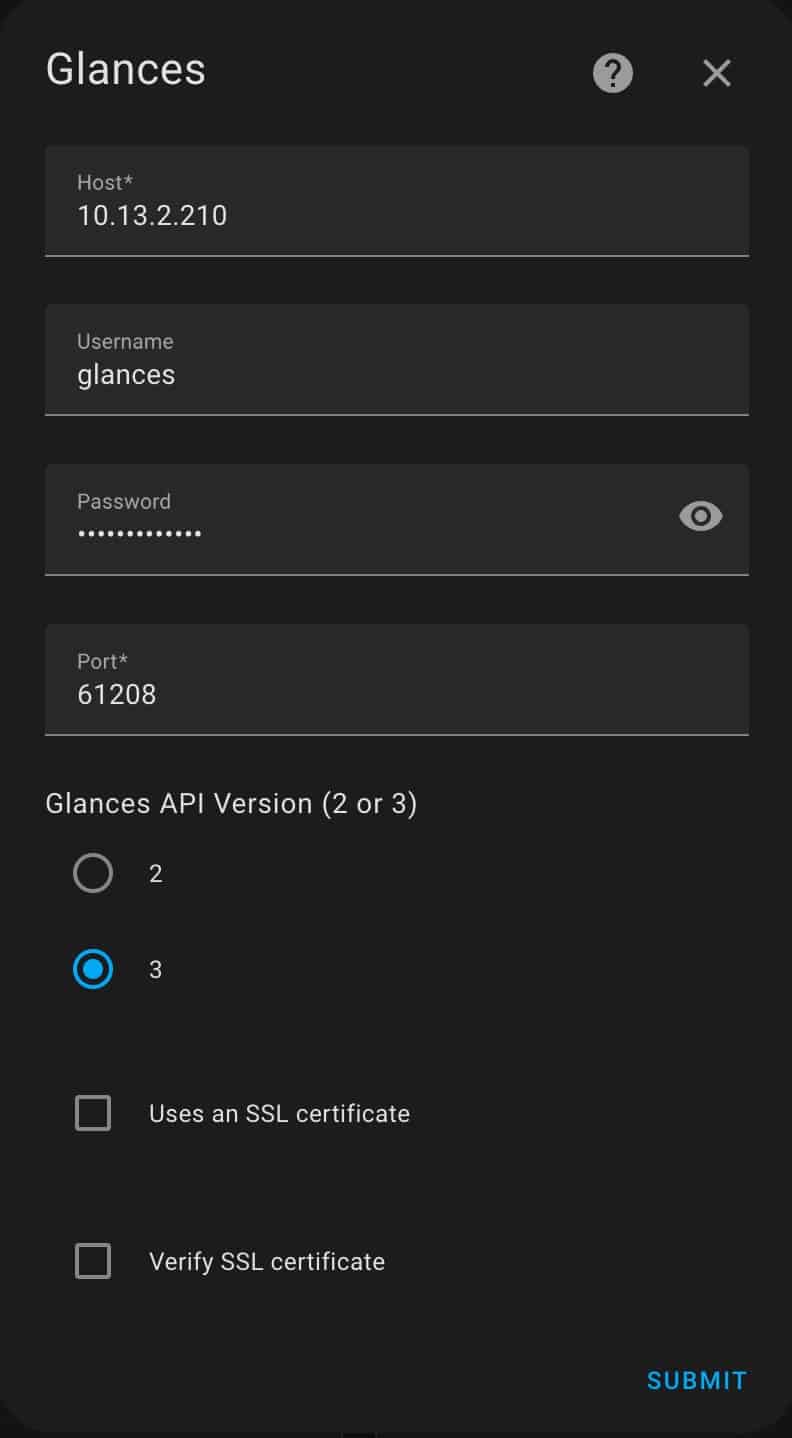
11. Click FINISH.
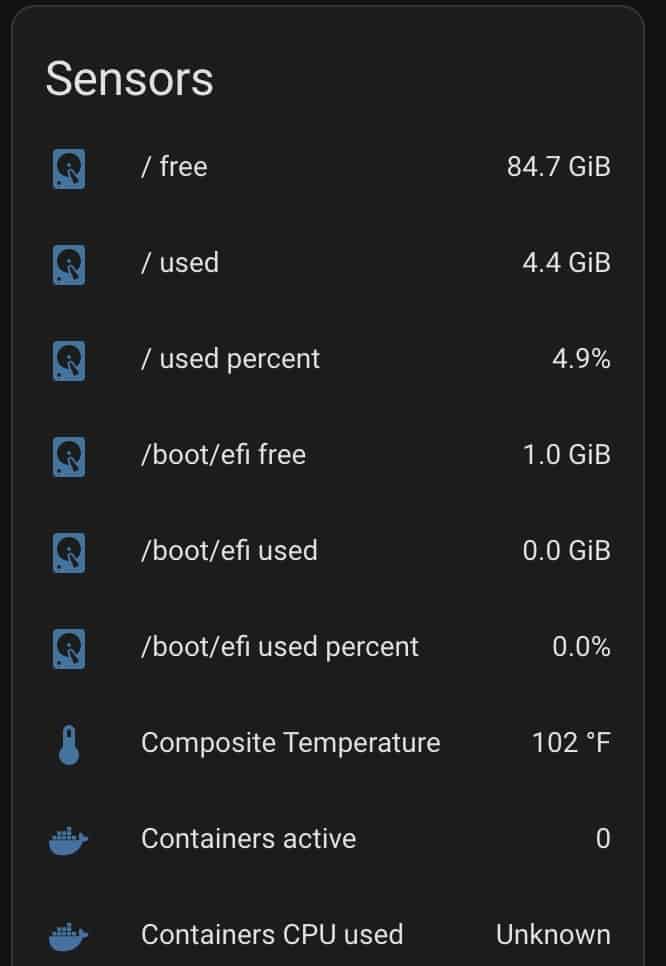
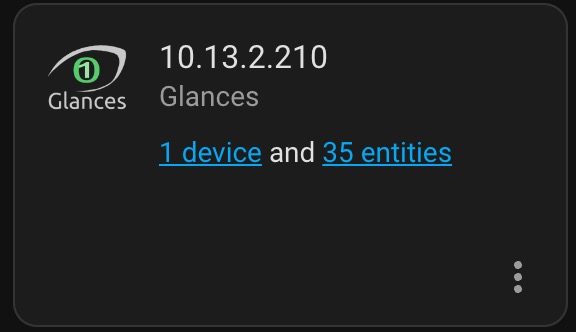
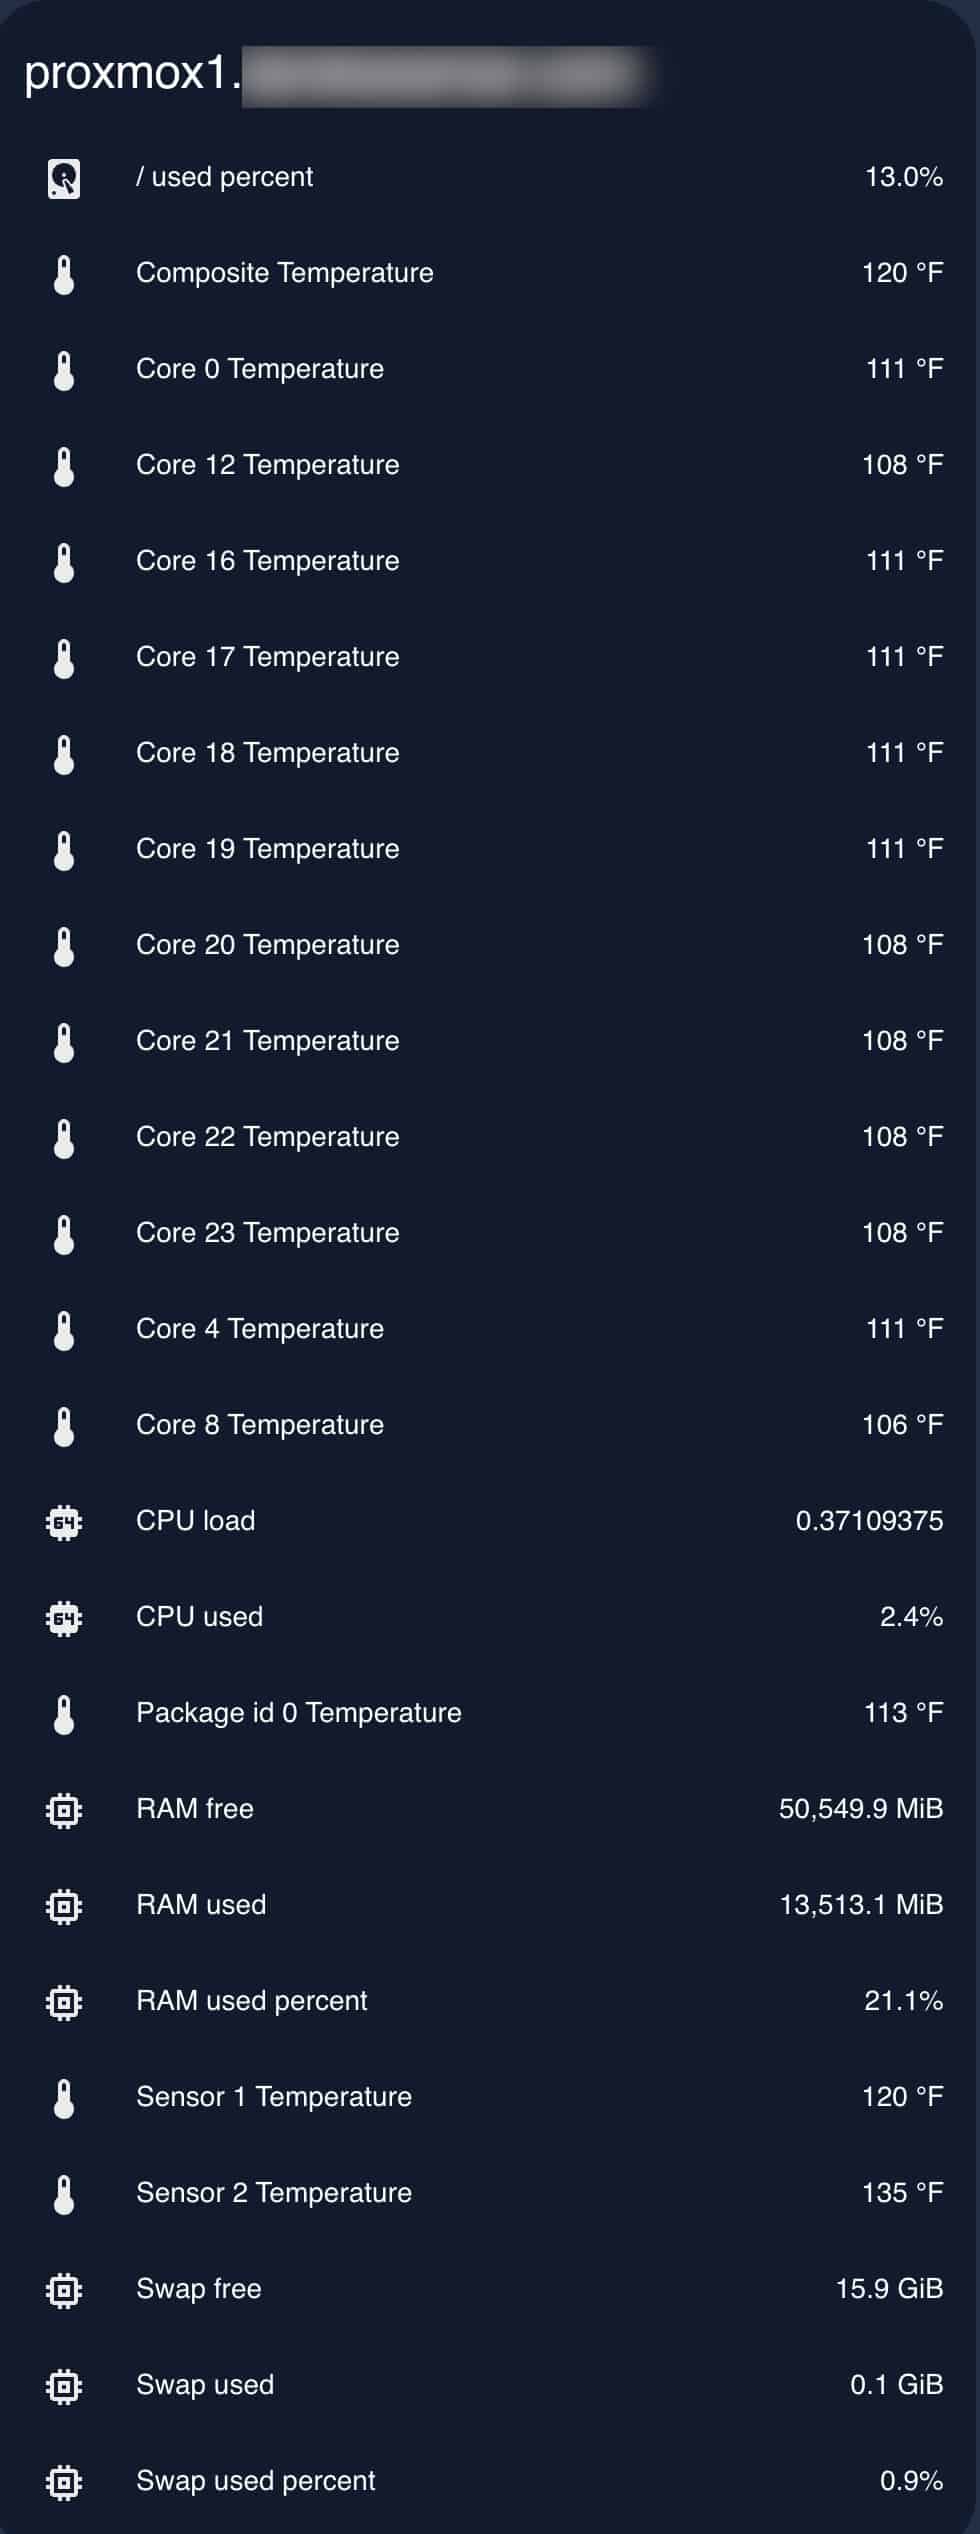
12. If you go to the Integrations page you can click on the Device and see the default sensors card with all the sensor and their status.
13. This is just a sample of the built-in sensors. You can of course then customize your card to show whatever sensors you want.
Resetting the Password
If you need to reset the credentials for Glances, you can run the following commands:
					rm ~/.config/glances/glances.pwd
glances -w --username --password
systemctl restart glances.service
Summary
Installing Glances on your Proxmox host allows your Home Assistant server to monitor the hardware health of the host server. Installation is a little tedious, but not too difficult. This allows your Home Assistant dashboard to show a plethora of sensor data such as CPU temperature, storage utilization and more.


Thanks for the instructions, and they are working great for my main Proxmox server.
I see that Glances is configured for a single IP. Is there a way to monitor multiple Proxmox servers?
Yes, the add-on can monitor multiple servers. Just repeat the add-on process and use the IP of the second proxmox server.
Just upgraded to ve 8 and it seems glances was gone. So I tried to reinstall but it doesn’t work now any ideas?
Thanks for reminding me to update the Glances post. Yes, Proxmox VE 8.0 and the current versions of Glances don’t work together.
Update! Thanks to tteck he provided a fix for the Glances issues. I’ve updated the post, and now it works great on Proxmox VE 8.0.
Hello! I’ve tried this using every possible combination and I get “failed to connect”. Oddly enough I get the same error when trying to use the Proxmox HA Integration. I’ve narrowed it down to (what I think is) Proxmox refusing the connection despite the permissions/username/password/IP all being correct. Any ideas?
I had the same issue, turns out I needed to read step 6 more carefully (thanks to user Tiim for pointing that out in the comments)
how would you export all the data to an influxdb that is installed via HA? I guess would need to create a configuration file for glances and then put the host as the docker name? setup a glances db in influx? and start it with a conf flag? Has anyone done this? this would be great as there are already Grafana dashboards that work with influx data (and not data from this integration) Thanks
Thx man, great stuff!!
This worked beautifully – thanks!
I had to use
as the ExecStart command in /etc/systemd/system/glances.service or else it ignored the credentials and made the info accessible for anonymous users
Thanks, I’ve updated the procedure.
Hi,
I’ve updated to PVE8 clean install and now with Glances I can’t see the HDD temp or in general it can’t detect any SCSI interface.
Any idea what could be wrong?
Found a solution myself :-).
So lm-sensors which are used by Glances doesn’t have “enabled” drivetemp readings from S.M.A.R.T. Drive Temperature by default. Also “sensors-detect” command will not load these readings.
In order to get it I had to load them manually to sensors using “modprobe drivetemp” command.
Thank you for approving this comment, maybe it will help someone in the future.
@Derek Seaman maybe it would make sense to mention this in your guide that some specific data are not available by default and maybe just add a link to lm-sensors docs.
Anyway thank you for this guide it’s very nice 😉
Thanks! I updated my post and added a step.
Thank you for the instructions, I was able to set this up easily.
However, I noticed the CPU temps I get when running lm-sensors are different than what’s reported in Glances. lm-sensors says Package id 0: +36.0°C whereas Glances says 127 F (so around 53 C). Any idea why there’s this discrepancy? I’m using an i7-1255U btw.
Just a quick note – when you define the username and password – IF you change the username from “glances” remember to put this in the config file:
Like an idiot I did this and all I saw was an exception in the syslog which eventually I worked out.
Thanks for a great post!
From a fellow idiot: THANK YOU!
I uninstalled it using:
sudo pip uninstall glances
But how do i remove also the dependencies which were installed with this package?
To remove Glances and un-used dependencies: sudo apt-get remove –auto-remove (glances package name)
The install command runs and gives me this at the end:
Install dependencies
error: externally-managed-environment
× This environment is externally managed
╰─> To install Python packages system-wide, try apt …
[TRUNCATED]
…
note: If you believe this is a mistake, please contact your Python installation or OS distribution provider. You can override this, at the risk of breaking your Python installation or OS, by passing –break-system-packages.
hint: See PEP 668 for the detailed specification.
—
Then the next command does not run:
glances -w –username –password
Not an expert here, so appreciate the help.
I’m also getting an error on step 3
I got it working by asking perplexity. Needed me to install in a virtual environment, then install a bunch of things again and then install more stuff https://www.perplexity.ai/search/rm-rf-usr-lib-python3-external-aMCmhzSoQ2WexGj3WFMuGQ
Thanks a lot for this excellent guide! One addition: I didn’t feel comfortable with the first step: rm -rf /usr/lib/python3.*/EXTERNALLY-MANAGED
I found several warnings against that step. Here is an alternative that seems to work for me
apt-get install pipx
Now use pipx instead of pip to install glances. The first step to remove the EXTERNALLY-MANAGED files is not needed for this installation path.
pipx install ‘glances[all]’
Now glances is installed, you find the binary here /root/.local/bin/glances
However, the service fails to execute since the binary in roots home, so we need to put it somewhere else.
cp /root/.local/bin/glances /usr/local/bin
Make sure that /usr/local/bin is in your PATH variable (check echo $PATH), and /root/.local/bin/ is not in your PATH variable. If it is, remove the entry to add /root/.local/bin/ in your /root/.bashrc file (might need a restart, I at least didn’t know how to get a fresh terminal in proxmox). Possibly a symlink instead of cp is more elegant — I don’t know.
I tried installing it on Proxmox 9 but can’t get it to work. Anything i’ve missed?
It says that command not found at step 3
Thanks for the reminder. I’ve totally revamped the install routine to work on Proxmox 8.x and 9.x. Give it a try now.