Sometimes Nutanix customers or prospective customers will want to perform IOmeter testing to ensure the block is performing up to par. Or maybe they are upgrading to a new NOS release or doing a POC and want to ballpark performance. Performing benchmarks on a Hypeconvered platform like Nutanix is a bit different than the traditional 3-tier architecture. Nutanix has a concept of CVMs (controller VMs) that run on each node (server). These CVMs service I/Os, and scale out 1:1 as you add more nodes. This gives rise to the great linear performance of the Nutanix platform. No more legacy two-controllers architecture that don’t scale up well.
In order to accurately assess the ballpark performance of a Nutanix cluster you will need to deploy at least one IOmeter VM per node, and configure that VM in a particular manner. Specifically, you will get the best I/O performance when spreading the workload across 8 virtual disk (VMDKs in the VMware world) and across multiple SCSI controllers. You also need to increase the number of vCPUs to 8, so Windows can better service all of the I/Os. And this might be news to some, but you don’t want to perform tests on NTFS formatted disks. What? Yes, you want IOMeter to use raw disks. Using NTFS formatted disks introduces an additional layer of caching and even lazy writes can be introduced into the picture.
Now that you understand a bit of the IOmeter configuration background, let’s deploy IOmeter and walk through all these steps.
Deploying IOMeter on Nutanix
1. Use the vSphere client and connect to the vCenter that is managing your Nutanix cluster.
2. Deploy your favorite Windows server VM template. This will be our IOMeter master, which we will clone later on.
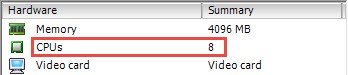
3. While the VM is powered off, increase the number of vCPUs to 8.
4. Add 8 VMDKs to the VM, spreading them evenly across the four SCSI controllers (e.g. 0:x, 1:x, 2:x, 3:x.). I would suggest 8x 20GB thinly provisioned disks.
5. Change the new SCSI controllers (controllers 1 to 3) to Paravirtual (PVSCSI). You can use LSI Logic SAS as well, but the PVSCSI controller is more optimized for high IOPS and lower CPU utilization. Leave controller 0 as LSI Logic SAS so Windows can boot.
6. Install IOMeter. You can download it from here. Download the IOmeter configuration from here. Unzip the configuration files. Power down the master VM.
7. Clone the IOMeter master VM so that you have one VM per Nutanix node. Disable DRS on the cluster (if enabled) and vMotion the new VMs so that you have one IOmeter VM per node. Power on the IOmeter VMs.
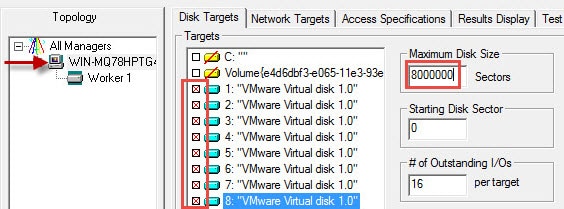
8. Launch IOmeter and load the 32k-sequential-write ICF file via the yellow folder icon in the upper left. Ignore any errors.
9. Click on the Computer name in the left pane then shift click and select all disks. Change *each* disk’s maximum disk size to 8000000.
10. Click on the Green flag to start the test. Wait a few minutes for the green flag to become unghosted. This will write data to all of the drives. Exit IOmeter.
11. Locate the benchmark that you want to run from the IO configuration files that you downloaded. In my example I’ll use 4k-random-read-2-outstanding-IO. Double click the configuration file to launch IOmeter.
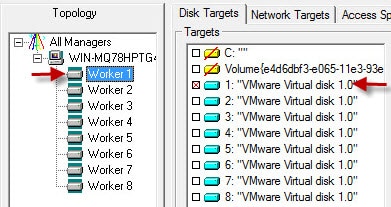
12. You should see 1 worker, and 8 VMware disks in right pane. Click on the Disk icon to add 7 more workers, for a total of 8. For each worker select the corresponding VMware virtual disk, as shown below. Worker 2 uses VMware disk 2, etc. Change the maximum disk size to 8000000.
 13. Click on the Access Specifications tab and select the 4K random read and add it. Click on the green flag to start the test. Change the update frequency from the drop down menu to a reasonable value like 5. Wait a few minutes for the performance to stabilize. Perform the same benchmark in the other IOMeter VMs and wait for the IOPS to peak and level out. You are now testing the total cluster IOPS capacity. For example, if you have three nodes and each IOMeter instance is pushing 20K IOPS, then the cluster can sustain 60K IOPS.
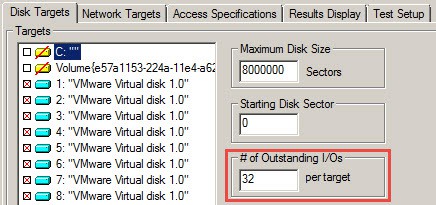
Outstanding I/Os
One parameter within IOMeter that can have a big effect on the total IOPs is the number of outstanding I/Os per target. This parameter adjusts how many I/Os are “in flight” to the storage controller. As you increase the number of outstanding I/Os you increase storage latency, but it can also increase performance. There’s a balance between the number of outstanding I/Os and latency. For example, during a test run if I set the outstanding I/Os to 4, latency during 100% read tests was right at 1ms with 33K IOPS for a single node. Jacking it up to 16 outstanding IOs increase IOPS to 58K but latency went up to 2.1ms. Using 64 outstanding IOs latency jumped up to 7.6ms and IOPS peaked at 67K. For this particular test 16 outstanding I/Os gave a good balance between latency and IOPS.
Summary
As you can see from this setup, the Nutanix performance scales linearly as you add more nodes. Each CVM processes IOs and as you add more nodes, you scale the CVMs and the total cluster performance. You can also see the scale-out IOPS performance within the VM by starting with one worker, benchmarking, then incrementally add workers. As you will see once you get to about 8 VMDKs and workers the performance tops out. You can also affect IOPS performance by changing the number of outstanding IOs. Latency increases as you increase the number of in flight IOs.
This design principal, of distributing workloads across multiple VMDKs within a VM carries across through our Exchange, SQL, Oracle and other best practices that Nutanix has published. This enables those applications to take full advantage of the web-scale architecture and linear performance that Nutanix brings to the table. Go hyperconvergence!


Hi Derek, The IO meter config file share is not any more available